2/26/2015 Monthly Core CPI / CPI Report (0830 EST)
Core CPI Forecast: 0.1%
Core CPI Actual: 0.2%
Previous Revision: n/a
CPI Forecast: -0.4%
CPI Actual: -0.2%
Previous Revision: n/a
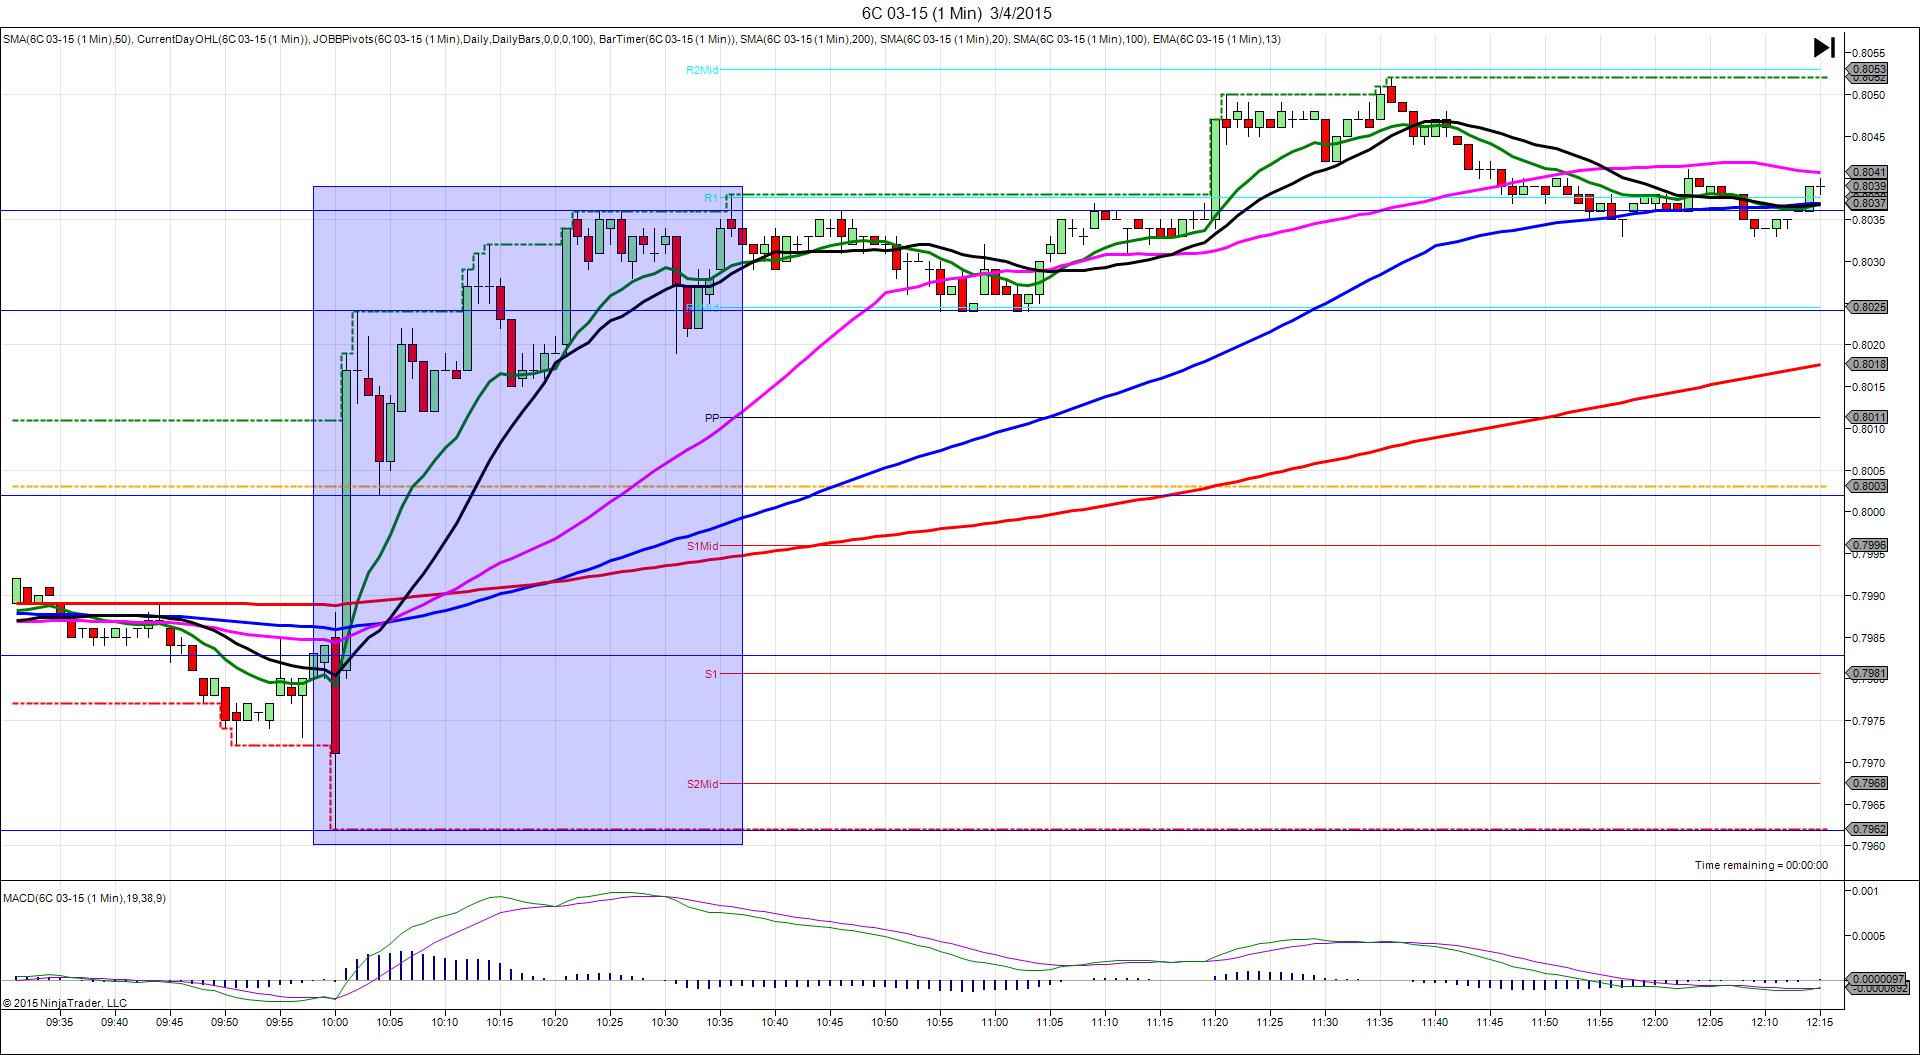
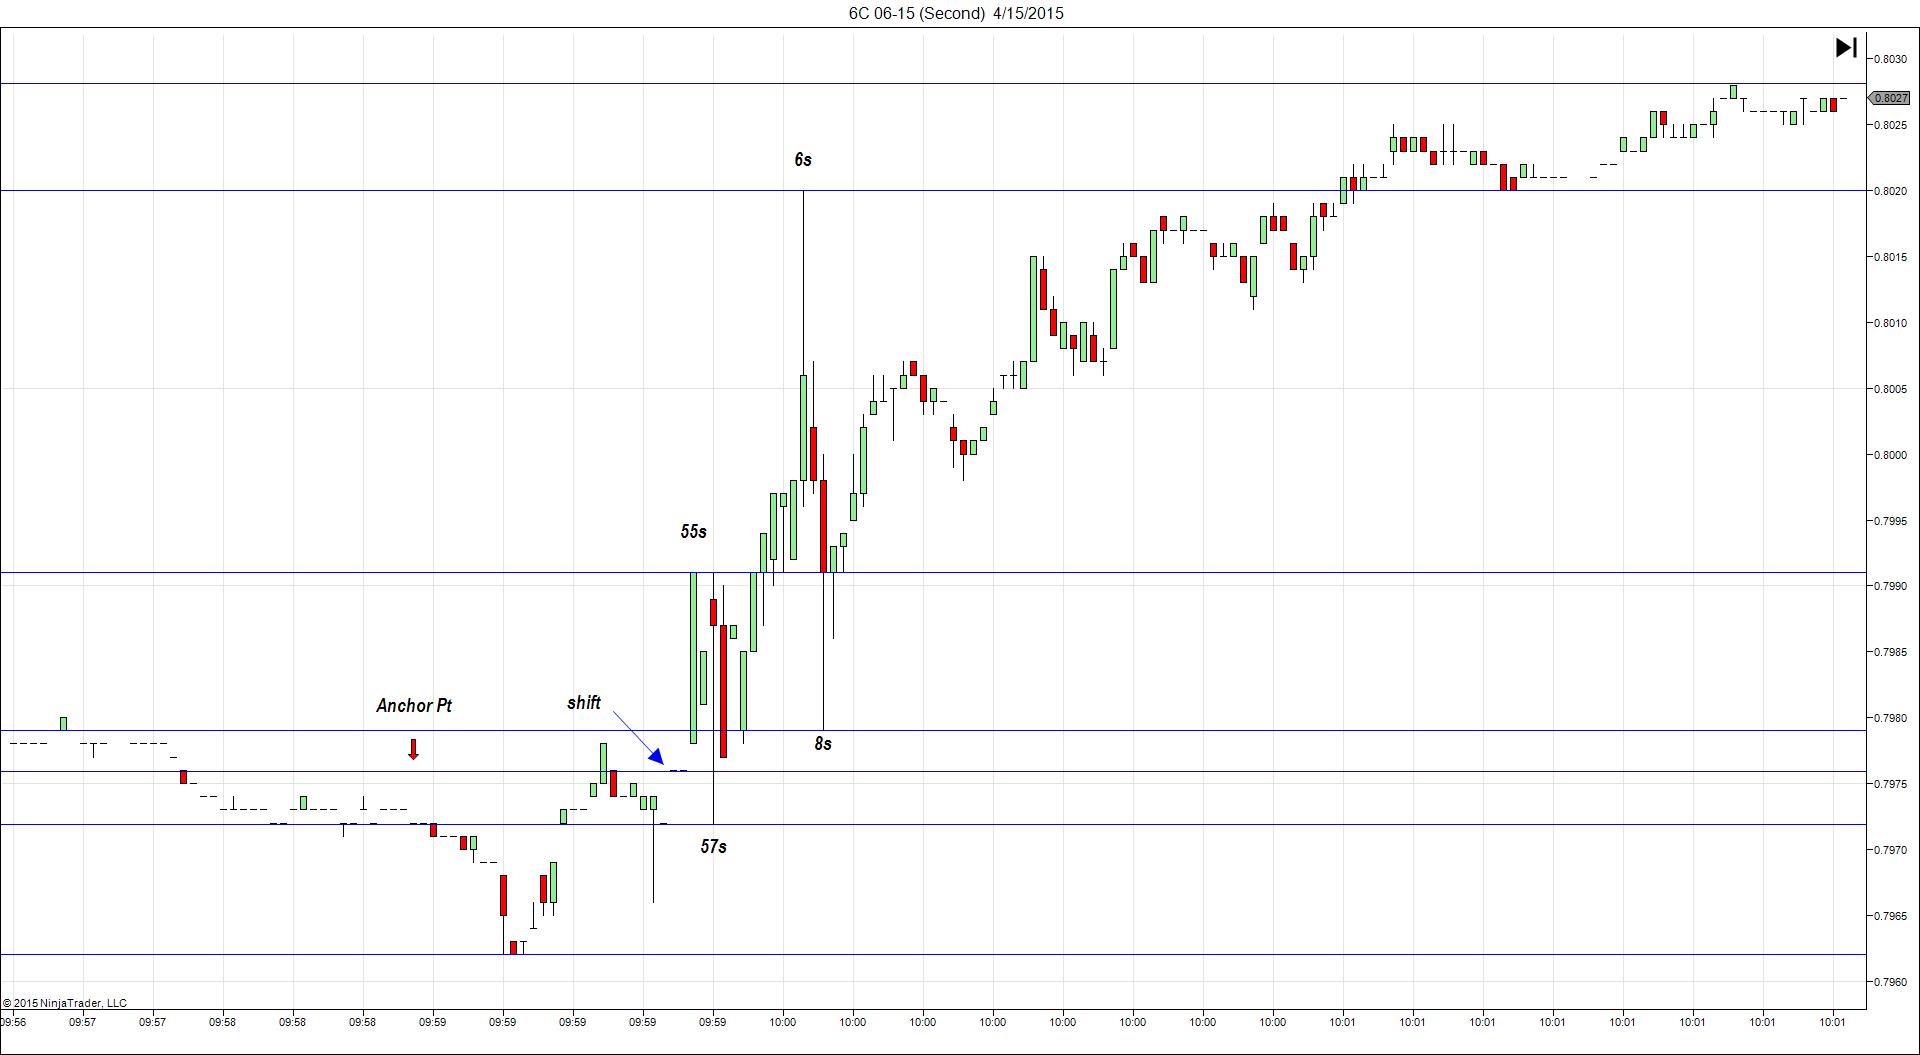
TRAP TRADE – OUTER TIER
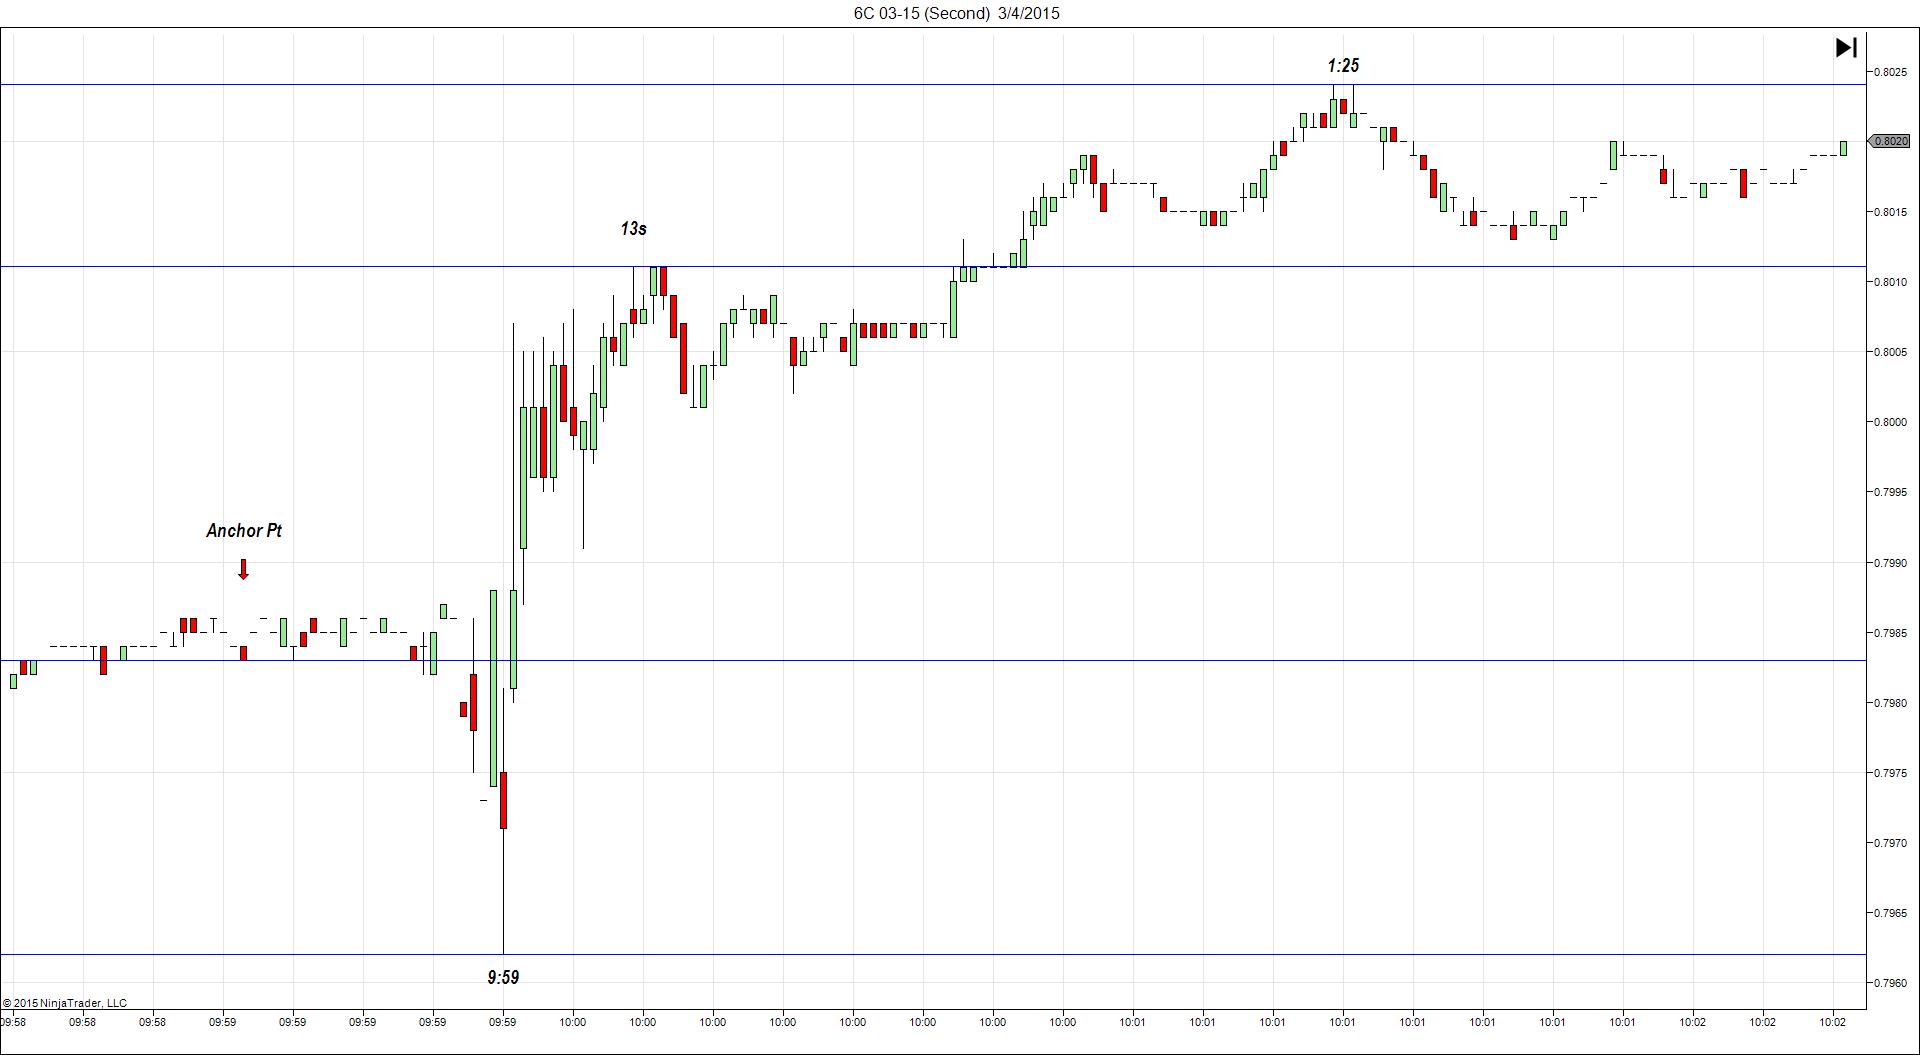
Anchor Point @ 0.8018 (last price)
—————-
Trap Trade:
)))1st peak @ 0.8050 – 0830:09 (1 min)
)))32 ticks
)))Reversal to 0.8028 – 0831:10 (1 min)
)))-22 ticks
—————-
Pullback to 0.8044 – 0838 (8 min)
16 ticks
Reversal to 0.7987 – 0905 (35 min)
57 ticks
Pullback to 0.8015 – 0923 (53 min)
28 ticks
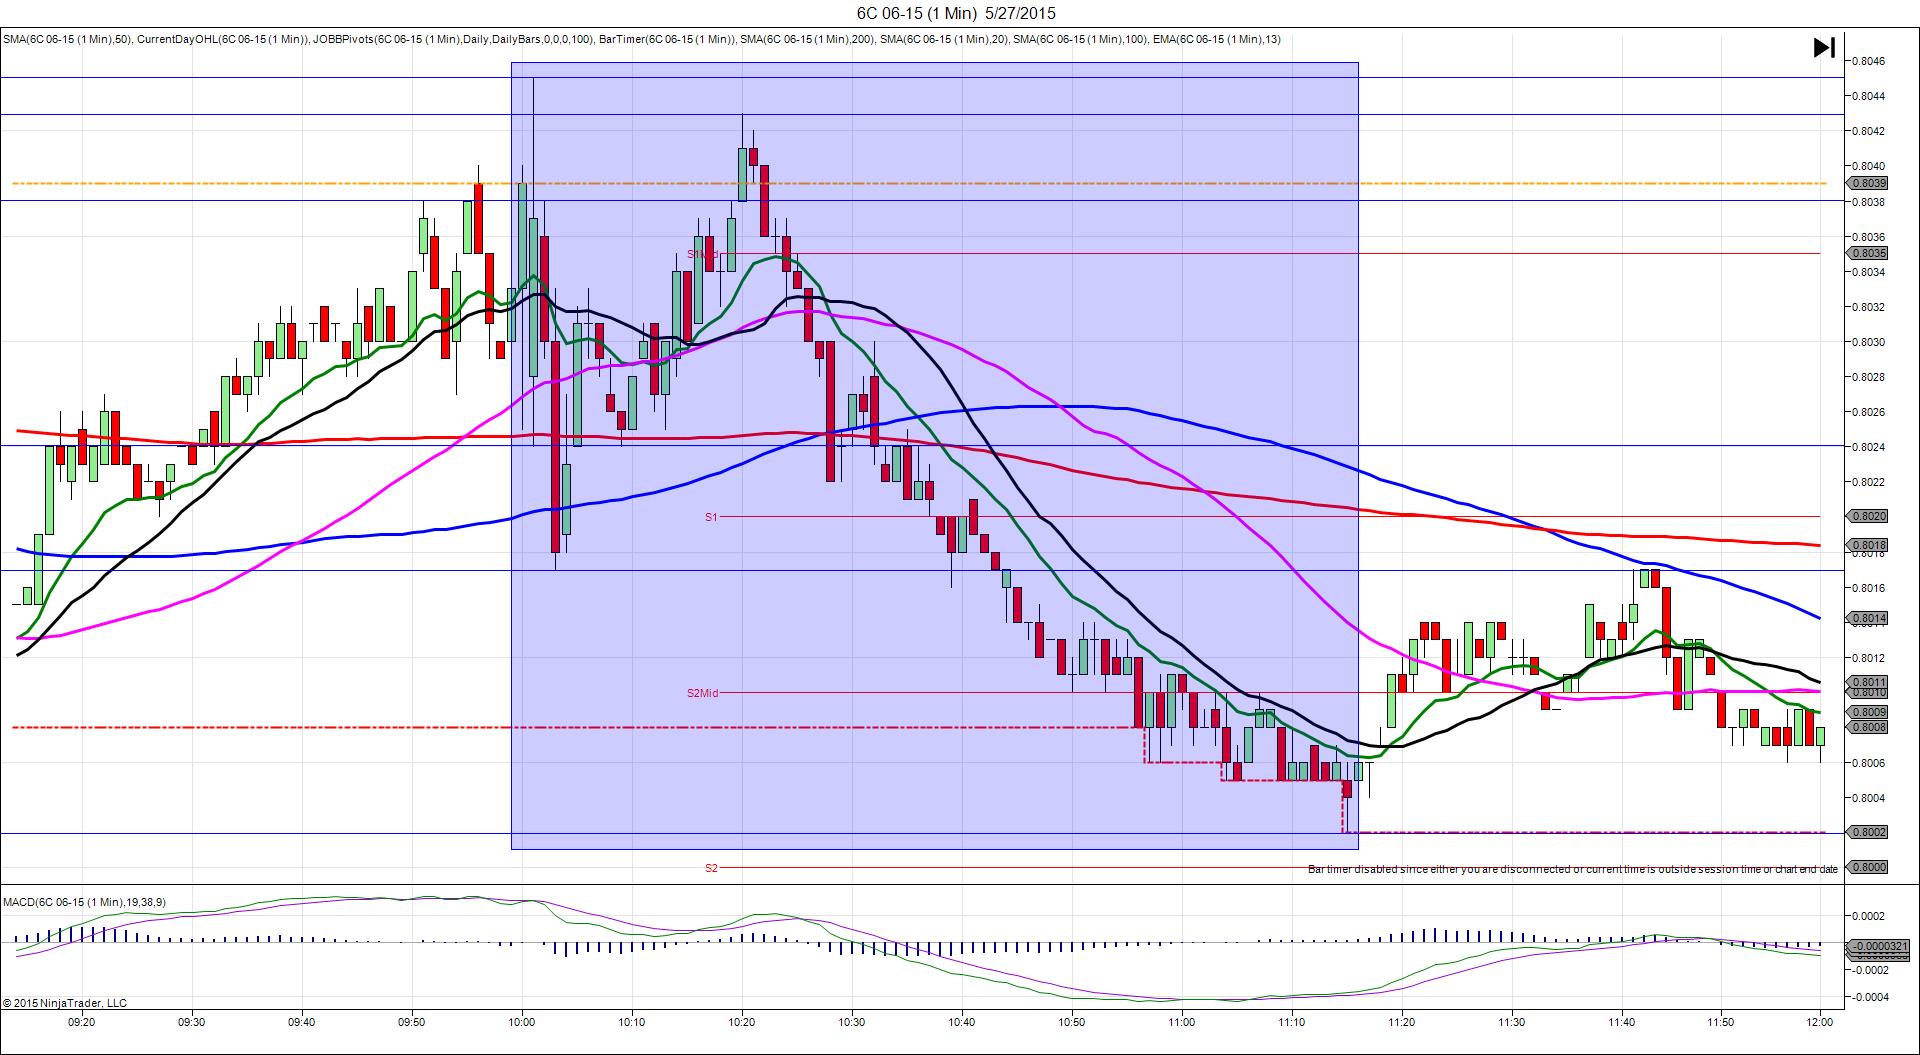
Trap Trade Bracket setup:
Long entries – 0.8006 (just below the S2 Pivot / LOD) / 0.7999 (No SMA / Pivot near)
Short entries – 0.8028 (just above the S1 Pivot) / 0.8038 (just above the 200 SMA, on the OOD)
Notes: Report slightly exceeded the forecast on the core reading and also exceeded the forecast by 0.2% on the broader reading. This caused a big long spike of 32 ticks in 9 sec to reach the R1 Mid Pivot, then reverse. This would have filled both short entries with an average short position at 0.8033. It reversed and hovered about 5 ticks in the red initially near the PP Pivot, then it pulled back and reversed further on the :32 bar. With no other news, the 200 SMA and PP Pivot acting as resistance, you can be patient and wait for a larger reversal. In this case it would have allowed about 3 ticks exit where it hovered early in the :32 bar or 6 ticks early in the :33 bar. After that it pulled back 16 ticks in 6 min to the PP Pivot before reversing 57 ticks in 27 min to the S3 Mid Pivot. Then it pulled back 28 ticks in 18 min to the 100 SMA.