6J 06-15 (1 Min) 3.19.2015

 Philly FED Manufacturing Index  Comments Off on 6J 06-15 (1 Min) 3.19.2015
Apr 042015
 

6J 06-15 (1 Min)  3_19_2015

Caption for 3/19:
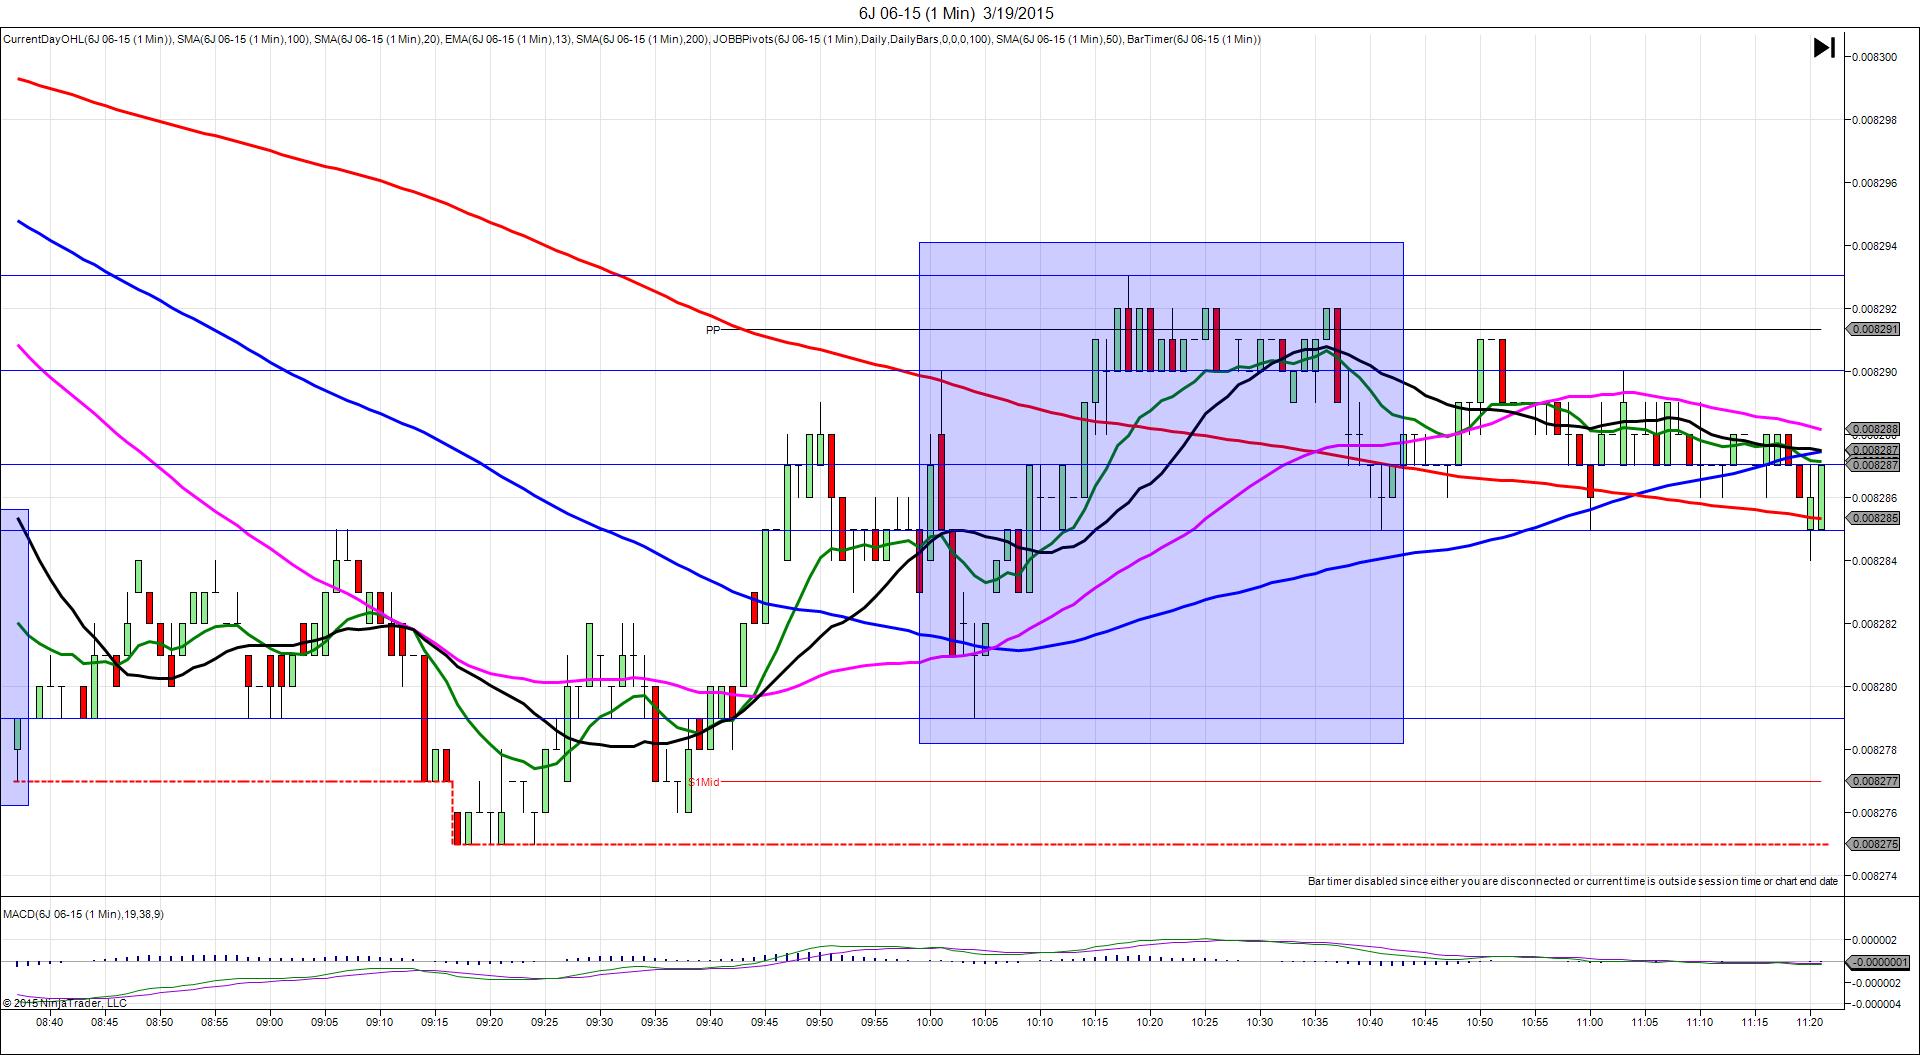
3/19/2015 Monthly Philly FED Manufacturing Index (1000 EDT)
Forecast: 7.2
Actual: 5.0
Previous revision: n/a
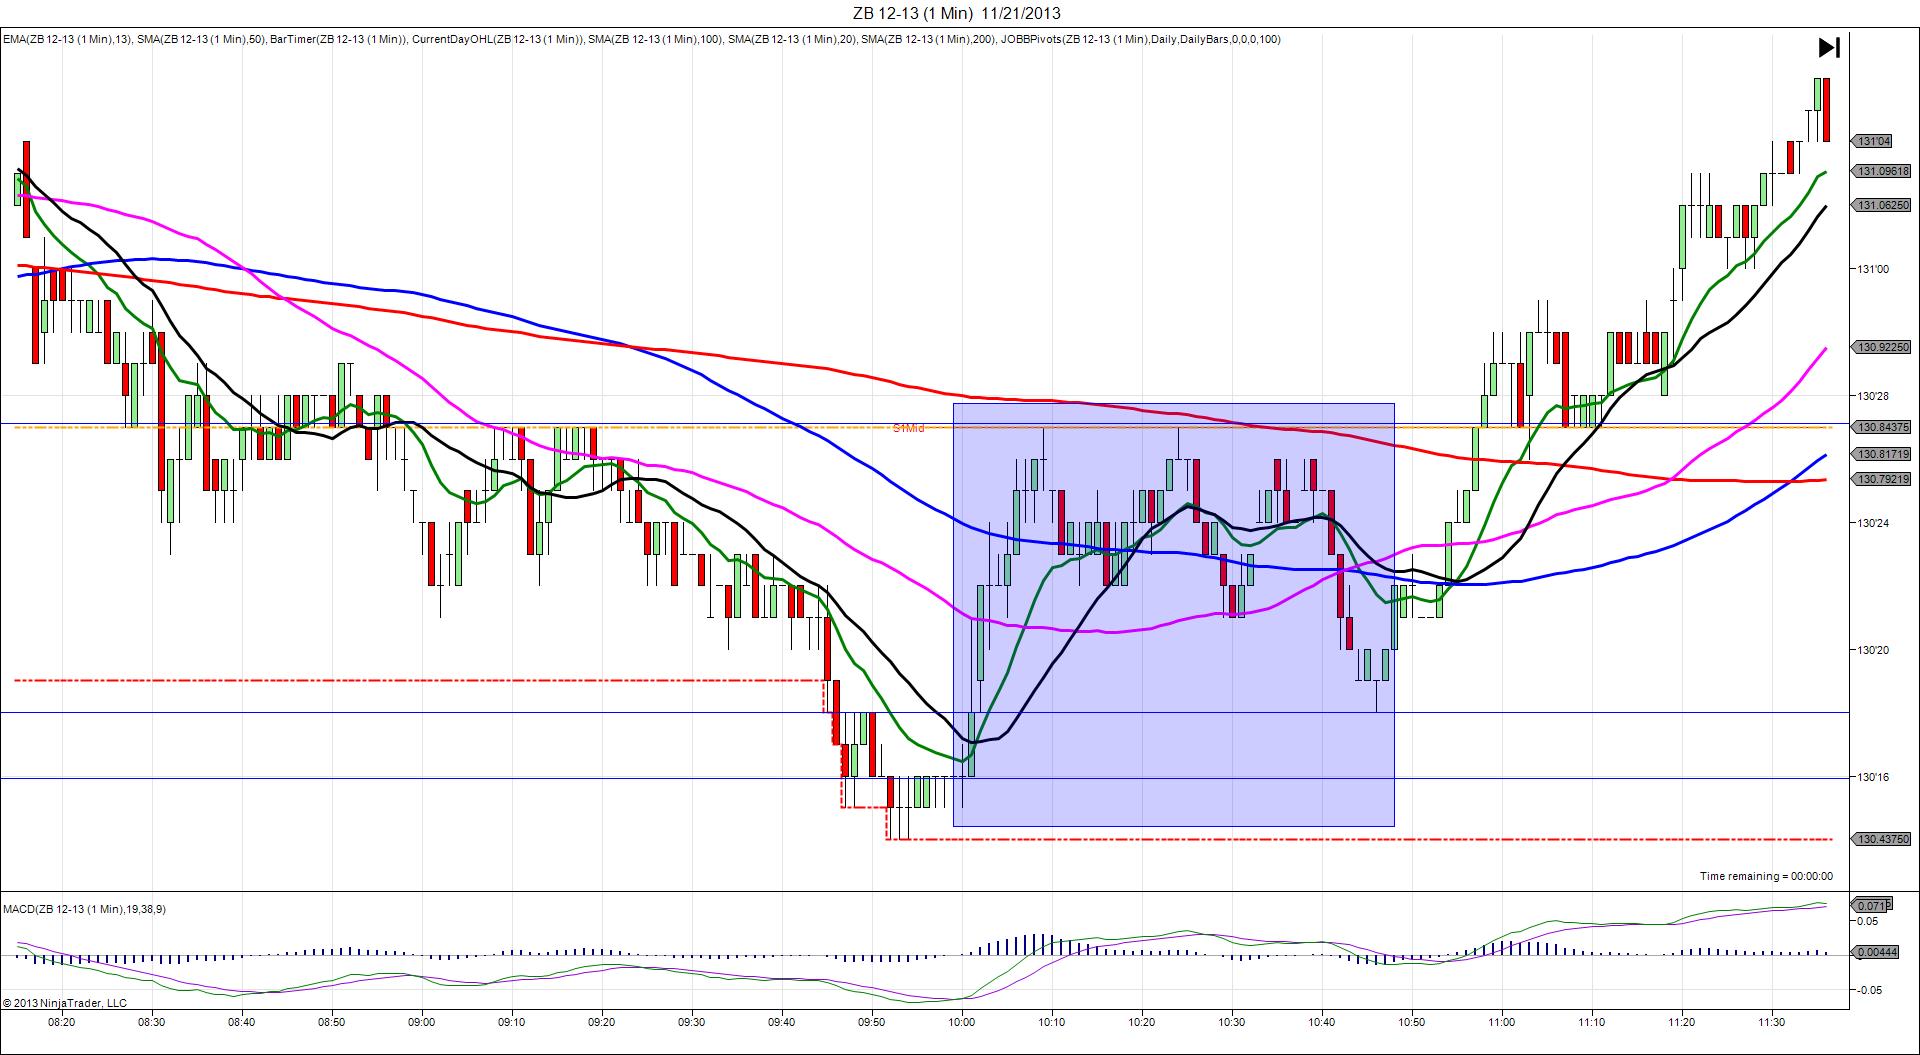
DULL REACTION (NO FILL)…SPIKE WITH 2ND PEAK
Started @ 0.008287
1st Peak @ 0.008290 – 1000:12 (1 min)
3 ticks

Reversal to 0.008279 – 1004 (4 min)
11 ticks

2nd Peak @ 0.008293 – 1018 (18 min)
6 ticks

Reversal to 0.008285 – 1041 (41 min)
8 ticks

Notes: Report fell narrowly short of the forecast with a delta of only 2.2 pts, causing a slow developing long spike of 3 ticks that took 12 sec to peak on the 200 SMA. With the results, the 200 SMA and only 2 ticks movement after 10 sec, cancel the order. Otherwise you would have been filled long at 0.008290 then seen it hover 1-2 ticks in the red before reversing further. It fell 11 ticks in 4 min to cross the 50/100 SMA then ascended for a 2nd peak of only 3 more ticks to eclipse the PP Pivot in 14 min. Then it fell 8 ticks in 23 min to nearly reach the 100 SMA.

6J 06-15 (1 Min) 4.16.2015

 Philly FED Manufacturing Index  Comments Off on 6J 06-15 (1 Min) 4.16.2015
Apr 202015
 

6J 06-15 (1 Min)  4_16_2015

4/16/2015 Monthly Philly FED Manufacturing Index (1000 EDT)
Forecast: 6.5
Actual: 7.5
Previous revision: n/a
SPIKE WITH 2ND PEAK
Started @ 0.008404
1st Peak @ 0.008396 – 1000:37 (1 min)
8 ticks

2nd Peak @ 0.008391 – 1006 (6 min)
13 ticks

Reversal to 0.008398 – 1010 (10 min)
7 ticks

Final Peak @ 0.008378 – 1055 (55 min)
26 ticks

Reversal to 0.008399 – 1114 (74 min)
21 ticks

Notes: Report narrowly exceeded the forecast with a delta of only 1.0 pts, causing a short spike of 8 ticks in 37 sec that started on the 200 SMA and fell to cross the PP Pivot / OOD. With JOBB and a 3 tick bracket, you would have filled short at 0.8400 with no slippage, then seen it trickle lower and hover near the bottom to allow 3-4 ticks to be captured. After that it continued to hover for 2 min and fell for another 5 ticks. Then it reversed 7 ticks in 4 min to the 13 SMA before falling for a final peak of 13 more ticks in 45 min to the S1 Pivot. Then it reversed 21 ticks in 19 min to the 200 SMA.

6J 09-15 (1 Min) 6.18.2015

 Philly FED Manufacturing Index  Comments Off on 6J 09-15 (1 Min) 6.18.2015
Jun 282015
 

6J 09-15 (1 Min)  6_18_2015

6/18/2015 Monthly Philly FED Manufacturing Index (1000 EDT)
Forecast: 8.1
Actual: 15.2
Previous revision: n/a
SPIKE WITH 2ND PEAK
Started @ 0.008156
1st Peak @ 0.008147 – 1000:01 (1 min)
9 ticks

Reversal to 0.008155 – 1003 (3 min)
8 ticks

2nd Peak @ 0.008145 – 1012 (12 min)
11 ticks

Final Peak @ 0.008133 – 1046 (46 min)
23 ticks

Reversal to 0.008152 – 1130 (90 min)
19 ticks

Notes: Report exceeded the forecast with a delta of 7.1 pts, causing a short spike of 9 ticks in 1 sec that started just below the 13 SMA and fell to cross the R2 Mid Pivot. With JOBB and a 3 tick bracket, you would have filled short at 0.008151 with 2 ticks of slippage, then seen it hover 2-3 ticks lower for 12 sec. Look to exit there with 2 ticks. It retreated, then fell again to hover in the same area late in the bar before reversing 8 ticks in 2 min to the 13 SMA. Then it fell for a 2nd peak of 2 more ticks in 9 min as the 13 SMA started encroaching as resistance. After that it fell for a final peak of 14 more ticks in 34 min before reversing 19 ticks in 44 min to the 200 SMA. As it fell it used the 13/20 SMAs for resistance and after the reversal, they were used as support.

CL 08-15 (1 Min) 7.16.2015

 Philly FED Manufacturing Index  Comments Off on CL 08-15 (1 Min) 7.16.2015
Sep 042015
 

CL 08-15 (1 Min) 7_16_2015

7/16/2015 Monthly Philly FED Manufacturing Index (1000 EDT)
Forecast: 11.9
Actual: 5.7
Previous revision: n/a
SPIKE WITH 2ND PEAK
Started @ 51.63
1st Peak @ 51.39 – 1000:59 (1 min)
24 ticks

Reversal to 51.48 – 1002 (2 min)
9 ticks

2nd Peak @ 51.19 – 1012 (12 min)
44 ticks

Reversal to 51.36 – 1023 (23 min)
17 ticks

Final Peak @ 51.00 – 1040 (40 min)
63 ticks

Reversal to 51.65 – 1142 (102 min)
65 ticks

Notes: Report fell short of the forecast with a delta of 6.2 pts, causing a short spike of 24 ticks that took the full bar to peak at the LOD / S1 Mid Pivot. With JOBB and a 3 tick bracket, you would have filled short at 51.58 with 2 ticks of slippage, then seen it peak late to allow up to 18 ticks to be captured. It reversed 9 ticks before falling for a 2nd peak of 20 more ticks in 10 min. Then it reversed 17 ticks in 11 min to the S1 Mid Pivot before falling for a final peak of 19 more ticks in 17 min. After that it reversed 65 ticks in 62 min to the OOD.

ZB 03-14 (1 Min) 1.16.2014

 Philly FED Manufacturing Index  Comments Off on ZB 03-14 (1 Min) 1.16.2014
Feb 082014
 

ZB 03-14 (1 Min)  1_16_2014

1/16/2014 Monthly Philly FED Manufacturing Index (1000 EST)
Forecast: 8.8
Actual: 9.4
Previous revision: n/a
SPIKE WITH 2ND PEAK
Started @ 130’28
1st Peak @ 131’03 – 1002 (2 min)
7 ticks

2nd Peak @ 131’07 – 1007 (7 min)
11 ticks

Reversal to 130’30 – 1026 (26 min)
9 ticks

Notes: Report mildly exceeded the forecast with a delta of only 0.6 pts, causing a slightly delayed long spike on the ZB that started on the 100 SMA, and crossed the 50 SMA and the R2 Mid Pivot on the :01 bar, and the HOD on the :02 bar. With JOBB, your order would have filled long at about 130’31 with 1 tick of slippage. Due to the location of the R2 Mid Pivot and HOD where the :01 bar was peaking, and the narrow offset of the report, look to exit at breakeven or 1 tick of profit. The extended reaction and size of the move were unusual for this situation as it achieved 7 ticks on the :02 bar and 4 more ticks on the :07 bar, crossing the R2 Pivot. Then it reversed for 9 ticks in the next 19 min, crossing the 100/50 SMAs and the R2 Mid Pivot.

ZB 12-13 (1 Min) 11.21.2013

 Philly FED Manufacturing Index  Comments Off on ZB 12-13 (1 Min) 11.21.2013
Dec 202013
 

ZB 12-13 (1 Min)  11_21_2013

11/21/2013 Monthly Philly FED Manufacturing Index (1000 EST)
Forecast: 15.8
Actual: 6.5
Previous revision: n/a
SPIKE WITH 2ND PEAK
Started @ 130’16
1st Peak @ 130’21 – 1001 (1 min)
5 ticks

2nd Peak @ 130’27 – 1009 (9 min)
11 ticks

Reversal to 130’18 – 1046 (46 min)
9 ticks

Notes: Report fell short of the forecast with a delta of 9.3 pts, causing a long spike on the ZB that started just above the LOD after a downtrend, and crossed the 50 SMA on the :01 bar. With JOBB, your order would have filled long at about 130’20 with 2 ticks of slippage, then look to exit at 130’23 on the 100 SMA with 3 ticks. The reaction was tame and slow, but due to the large offset, you can patiently wait for a better exit. It stepped higher for a 2nd peak of 11 ticks in 9 min, reaching the S1 Mid Pivot. Then it chopped sideways for several min before reversing 9 ticks 30 min or so after the 2nd peak. After that it rebounded and rallied for the next hour or so.

ZB 12-13 (1 Min) 10.17.2013

 Philly FED Manufacturing Index  Comments Off on ZB 12-13 (1 Min) 10.17.2013
Dec 202013
 

ZB 12-13 (1 Min)  10_17_2013

10/17/2013 Monthly Philly FED Manufacturing Index (1000 EDT)
Forecast: 15.4
Actual: 19.8
Previous revision: n/a
SPIKE / REVERSE
Started @ 133’24
1st Peak @ 133’17 – 1003 (3 min)
7 ticks

Reversal to 134’02 – 1124 (84 min)
17 ticks

Notes: Report moderately exceeded the forecast with a delta of 4.4 pts, causing a short spike on the ZB that started on the R2 Mid Pivot, crossed the 50/100 SMAs, and terminated at the 200 SMA on the :03 bar. With JOBB, your order would have filled short at about 133’21 with 1 tick of slippage, then look to exit at 133’18 on the 200 SMA with 3 ticks. After the peak, it struggled with the 200 SMA for a few min, the reversed to continue with the overall upward trend, capturing 17 ticks in the next 80 min. After that it pulled back and traded sideways.

ZB 09-13 (1 Min) 8.15.2013

 Philly FED Manufacturing Index  Comments Off on ZB 09-13 (1 Min) 8.15.2013
Oct 152013
 

ZB 09-13 (1 Min)  8_15_2013

8/15/2013 Monthly Philly FED Manufacturing Index (1000 EDT)
Forecast: 15.6
Actual: 9.3
Previous revision: n/a
SPIKE / REVERSE
Started @ 131’13
1st Peak @ 131’22 – 1002 (2 min)
9 ticks

Reversal to 131’12 – 1007 (7 min)
10 ticks

Notes: Report fell short of the forecast with a delta of 6.3 pts, causing a long spike on the ZB that crossed the 50/100 SMAs and S4 Mid Pivot for 9 ticks on the :01 and :02 bars. The market had been caught up in a huge selloff in the previous 5 hrs due to other news. With JOBB, your order would have filled long at 131’15 with no slippage, then look for the S4 Mid Pivot area at 131’19 or 20 as a target for 4-5 ticks. After the peak, it reversed for 10 ticks in the following 5 min back to the S4 Pivot. Then it traded sideways between the S4 and S4 Mid Pivots for about an hour.

ZB 12-13 (1 Min) 9.19.2013

 Philly FED Manufacturing Index  Comments Off on ZB 12-13 (1 Min) 9.19.2013
Oct 152013
 

ZB 12-13 (1 Min)  9_19_2013

9/19/2013 Monthly Philly FED Manufacturing Index (1000 EDT)
Forecast: 10.2
Actual: 22.3
Previous revision: n/a
SPIKE / REVERSE
Started @ 131’19
1st Peak @ 131’11 – 1001 (1 min)
8 ticks

Reversal to 131’19 – 1020 (20 min)
8 ticks

Notes: This report was not recommended for trading due to being double booked with Existing Home Sales. It would have been safe to trade as both reports were positive. Report exceeded the forecast with a delta of 12.1 pts, causing a short spike on the ZB that crossed only the LOD for 8 ticks on the :01 bar. The market was in a downtrend for the last hour before the report, so it used the 13/20 SMAs as a launching point of resistance. With JOBB, your order would have filled short at about 131’16 with 1 tick of slippage, then look to exit at 131’12 with 4 ticks as it hovered for about 8 sec. After the peak, it retreated on the :01 bar leaving 4 ticks on the tail naked, and after a double bottom, eventually reversed for 8 ticks in the following 20 min back to the 50 SMA. Then it chopped sideways between the falling SMAs and the LOD for the short term future.

ZB 09-13 (1 Min) 07.18.2013

 Philly FED Manufacturing Index  Comments Off on ZB 09-13 (1 Min) 07.18.2013
Aug 092013
 

ZB 09-13 (1 Min)  7_18_2013

7/18/2013 Monthly Philly FED Manufacturing Index (1000 EDT)
Forecast: 8.5
Actual: 19.8
Previous revision: n/a
SPIKE WITH 2ND PEAK
Started @ 135’08
1st Peak @ 134’30 – 1001 (1 min)
10 ticks

Reversal to 135’04 – 1007 (7 min)
6 ticks

Final Peak @ 134’19 – 1207 (127 min)
21 ticks

Reversal to 134’30 – 1238 (158 min)
11 ticks

Notes: Report exceeded the forecast with a delta of over 11 pts, causing a short spike on the ZB that crossed the 50/100 SMAs and hit the LOD for 10 ticks on the :01 bar. With JOBB, your order would have filled short at 135’05 with 1 tick of slippage, then look for the LOD and S1 Mid Pivot at 134’31 as a target for 6 ticks. After the peak, it reversed for 6 ticks in the following 6 min back to the 13 SMA, then it fell again to step lower for an extended final peak of 11 more ticks in 2 hrs as it hit the S1 Pivot and used the 100 SMA as resistance. Then it reversed for 11 ticks back to the S1 Mid Pivot and 200 SMA in about 30 min.