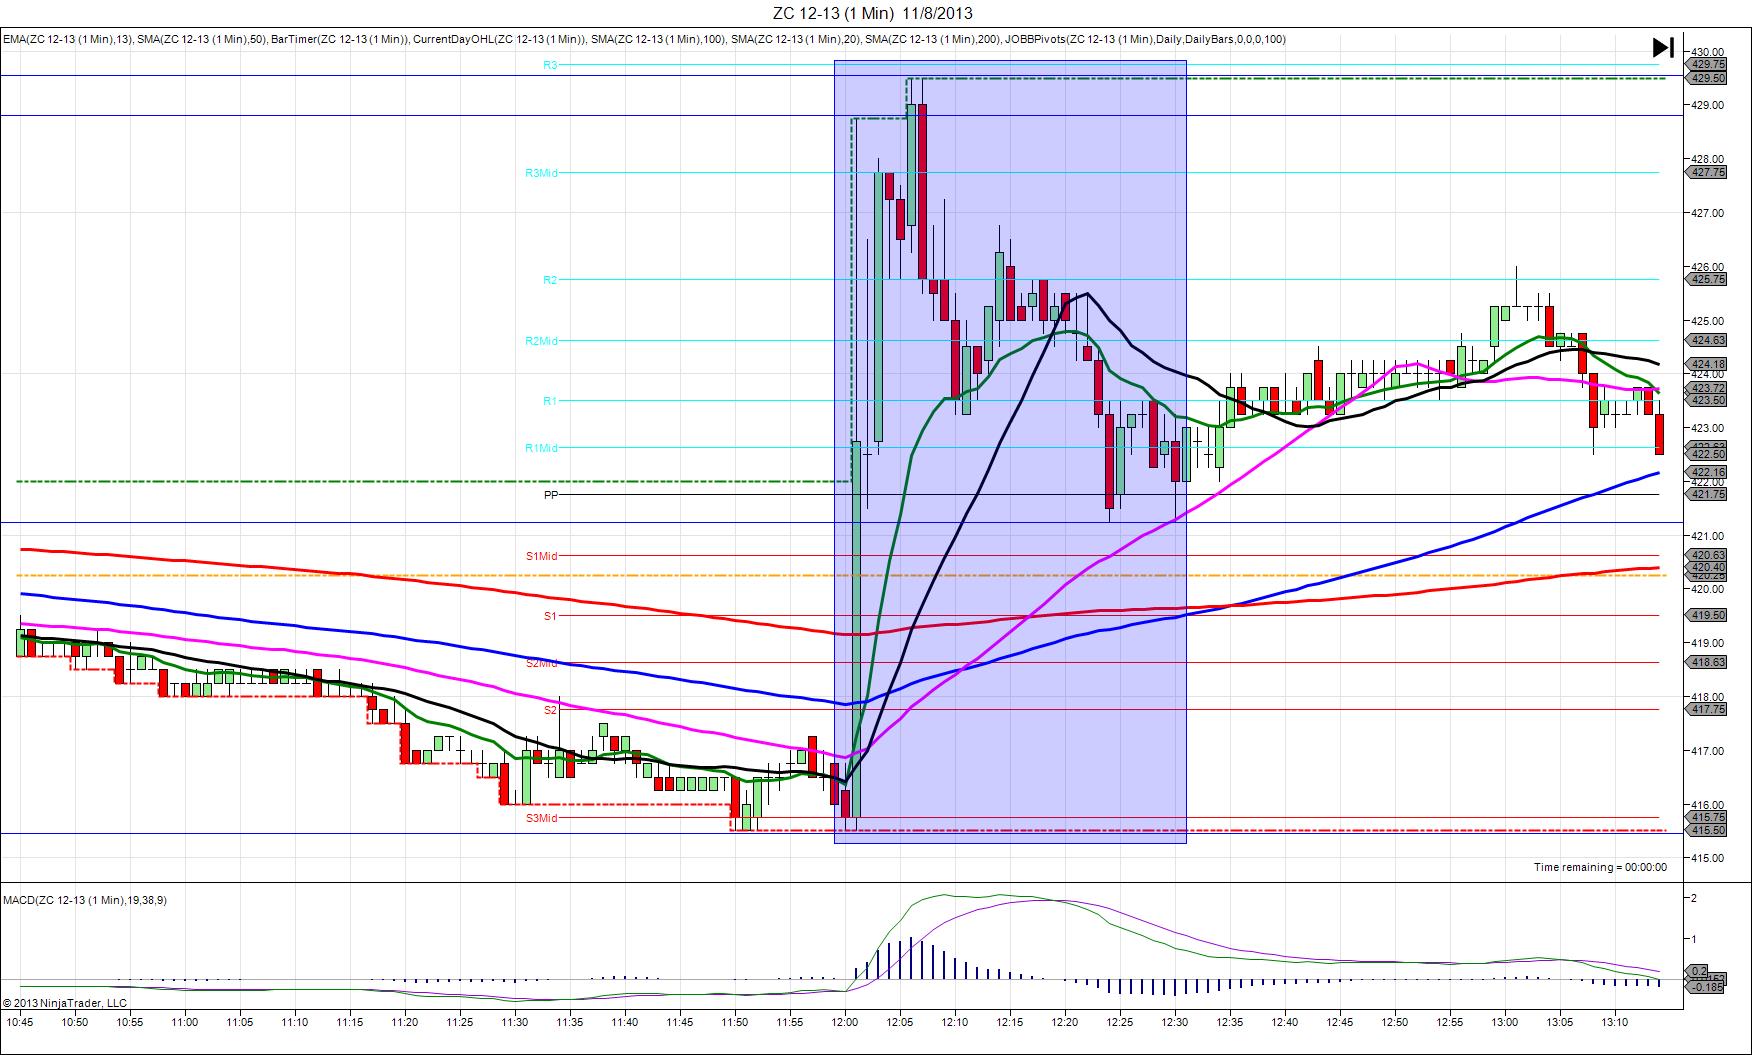
11/8/2013 World Agriculture Supply and Demand Estimates (WASDE) – Corn (1200 EST)
Forecast: n/a
Actual: n/a
SPIKE WITH 2ND PEAK
Started @ 415.50
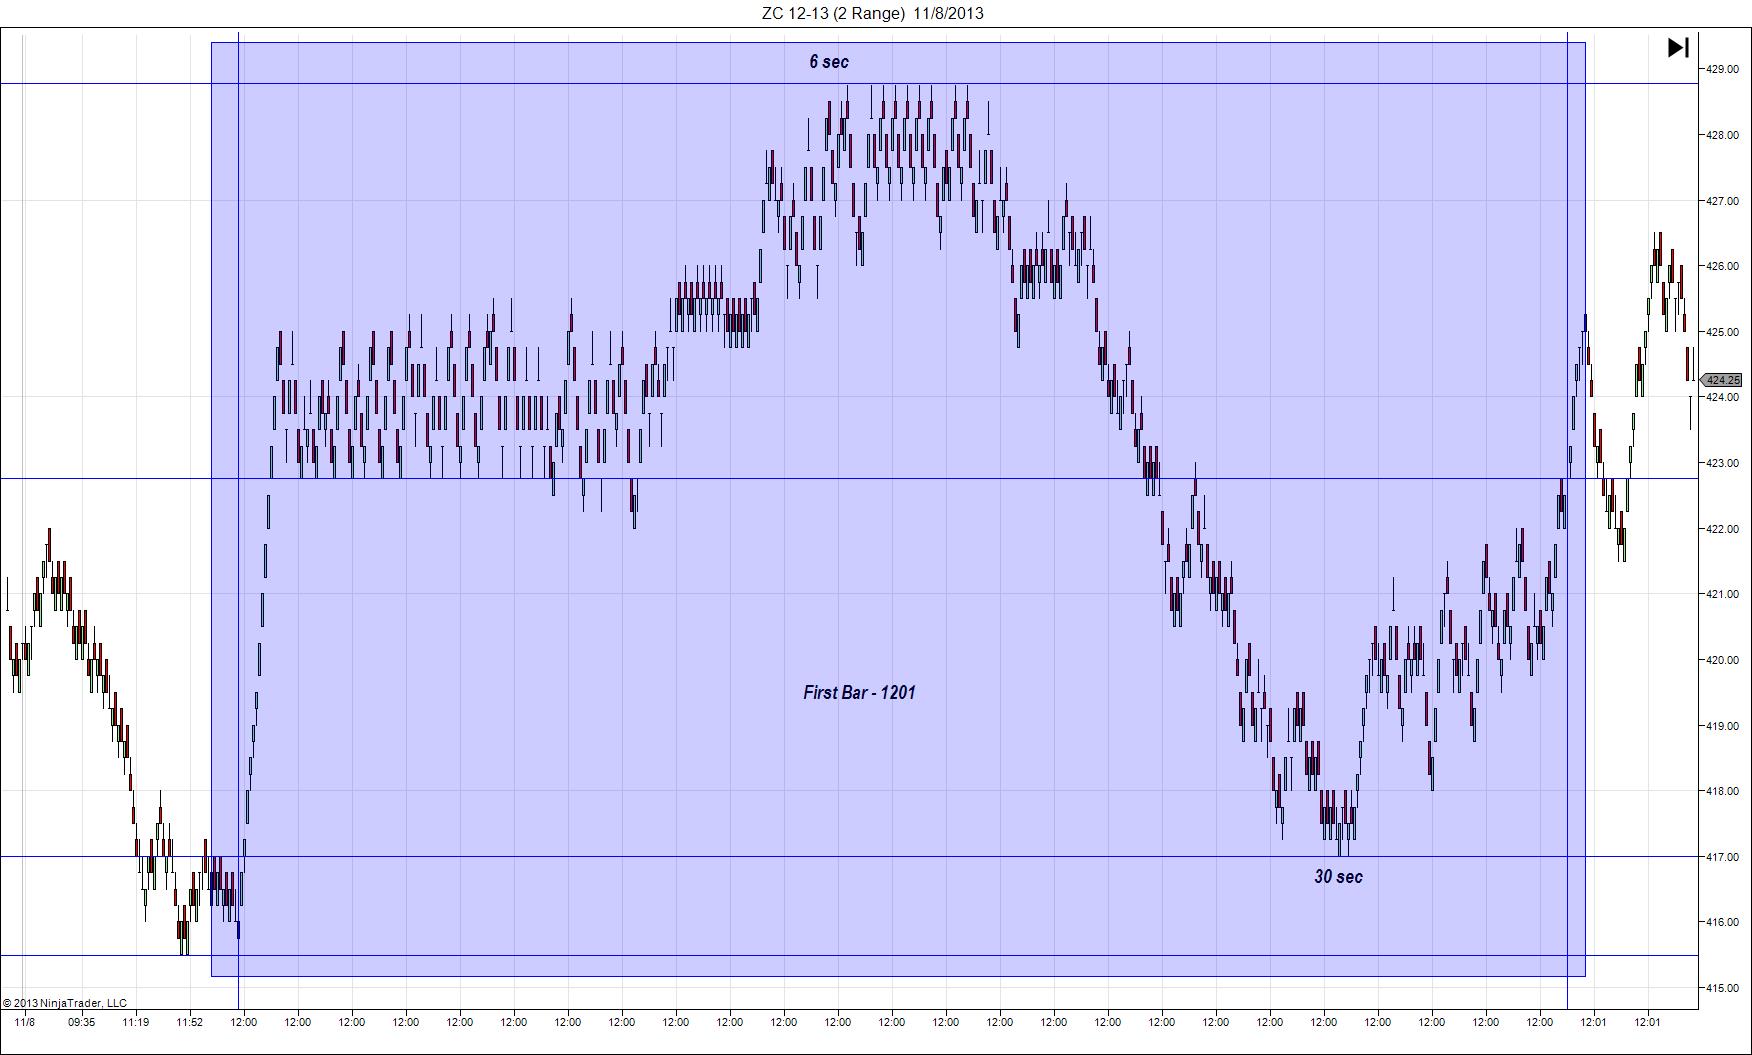
1st Peak @ 428.75 – 1200:06 (1 min)
53 ticks
Reversal to 417.00 – 1200:30 (1 min)
-47 ticks
2nd Peak @ 429.50 – 1206 (6 min)
56 ticks
Reversal to 421.25 – 1224 (24 min)
33 ticks
Notes: Due to the US Gov shutdown, the October report was skipped and embedded in this report. Report Reaction caused a healthy but unsustainable long spike of 52 ticks on the :01 bar that started on the S3 Mid Pivot then crossed all 3 major SMAs and eclipsed the R3 Mid Pivot while extending the LOD. With JOBB, you would have filled long at about 421.75 with abnormally high 20 ticks of slippage. After the fill, it peaked quickly and hovered between 424.75 and 428.75 until 13 sec into the bar. As this report is prone to achieve the peak quickly then reverse, look to exit where it hovered for 20+ ticks. After hovering, it reversed 47 ticks back to the 50 SMA at 30 sec, then rebounded for a 2nd peak that stepped higher to nearly reach the R3 Pivot on the :06 bar. Due to the high slippage, and the predictable model of this report, it would be safe to trade the reversal from the R3 Mid Pivot for 20-30 ticks, or trade the 2nd peak with a long entry when it fell to the 50 SMA for 20-40 ticks. After the 2nd peak, it reversed for 33 ticks to nearly reach the 50 SMA. After that it settled down and traded sideways.