CL 06-13 (1 Min) 5.16.2013

 Philly FED Manufacturing Index  Comments Off on CL 06-13 (1 Min) 5.16.2013
May 182013
 

CL 06-13 (1 Min)  5_16_2013

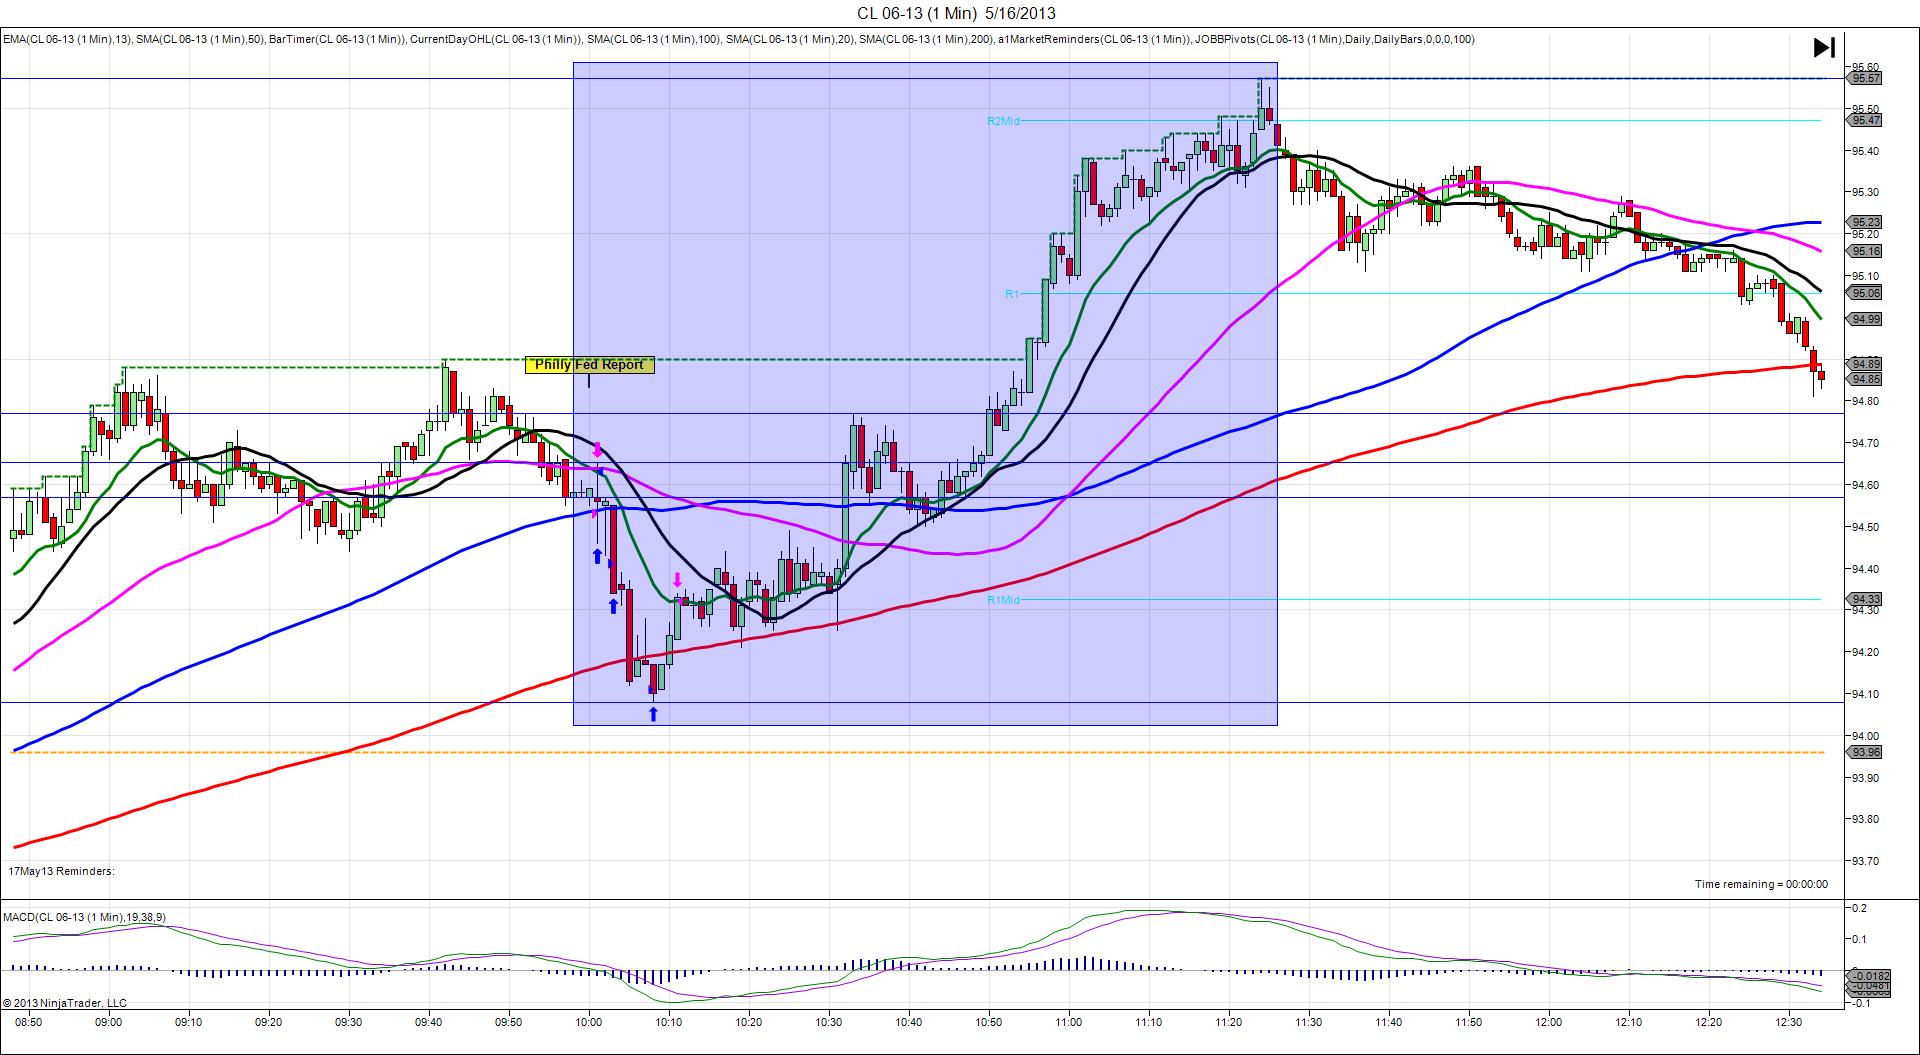
5/16/2013 Monthly Philly FED Manufacturing Index (1000 EDT)
Forecast: 2.5
Actual: -5.2
Previous revision: n/a
INDECISIVE then SPIKE WITH 2ND PEAK
Started @ 94.57
1st Peak @ 94.46 – 1001 (1 min)
11 ticks

Reversal to 94.65 – 1001 (1 min)
-19 ticks

2nd Peak @ 94.08 – 1008 (8 min)
49 ticks

Reversal to 94.77 – 1033 (33 min)
69 ticks

Extended Reversal to 95.57 – 1124 (84 min)
149 ticks

Notes: Report fell moderately short of the forecast with a delta of nearly 8, but this caused an indecisive :31 bar that had to contend with the 100 SMA, but a prolonged bearish reaction that was proper. This is the pattern with the CL these days. The results are decisive , but the initial reaction is muted and indecisive, then it delivers on the following 5 or so bars. With JOBB, your order would have filled short at about 94.53 with no slippage, then it would have only given you a fleeting 7 ticks as it oscillated between 4 ticks in the red and 7 in the green. The 10 tick stop was taken out, but a 15 tick stop would have ridden out the heat. There are 2 ways to play a report like this. 1) do not use JOBB, but upon seeing the bearish results, setup a sell limit up near the 50 SMA, or 2) move the stop up higher to about 3 ticks above the 50 SMA and wait for the delayed move. It conquered the 100 SMA on the :33 bar then paused briefly at the R1 Mid Pivot at 94.33 before crashing through the 200 SMA for a total 2nd peak of 49 ticks. Then it reversed for 69 ticks in 25 min and achieved an extended reversal of 149 ticks in a little less than 1.5 hrs.

CL 05-13 (1 Min) 4.18.2013

 Philly FED Manufacturing Index  Comments Off on CL 05-13 (1 Min) 4.18.2013
May 182013
 

CL 05-13 (1 Min)  4_18_2013

4/18/2013 Monthly Philly FED Manufacturing Index (1000 EDT)
Forecast: 2.7
Actual: 1.3
Previous revision: n/a
SPIKE/REVERSE
Started @ 87.19
1st Peak @ 86.31 – 1006 (6 min)
88 ticks

Reversal to 87.64 – 1134 (94 min)
133 ticks

Notes: Report slightly fell short of the forecast with a delta of only 1.4, but this caused a much larger than expected short spike of 88 ticks on 6 bars to eclipse the S1 Mid Pivot. The market had been in a selling mood for about 90 min before the report, likely adding to the magnitude of the short reaction. With JOBB, your order would have filled short at about 87.13 with 1 tick of slippage. Then it would be safe to stay in and watch how it handles the 87.04 area and the PP Pivot at 86.96, just below it. When the :02 bar blasted through both of those levels and sustained the drop, move the stop to above the PP and stay in until the move is finished. You could have stayed in to the S1 Mid Pivot and made up to 75 ticks. After the spike, it chopped higher fighting through many levels of resistance for 133 ticks in about 90 min.

CL 05-13 (1 Min) 3.21.2013

 Philly FED Manufacturing Index  Comments Off on CL 05-13 (1 Min) 3.21.2013
May 182013
 

CL 05-13 (1 Min)  3_21_2013

3/21/2013 Monthly Philly FED Manufacturing Index (1000 EDT)
Forecast: -1.6
Actual: 2.0
Previous revision: n/a
DULL REACTION (NO FILL)
Started @ 92.88
Range of next bar – 92.85 – 92.91 – 1001 (1 min)
+/- 3 ticks

Notes: Report marginally exceeded the forecast with a delta of about 3.5, but this was offset by a marginally disappointing Existing Home Sales report at the same time resulting in a very dull reaction that traveled no more than 3 ticks away from the origin in either direction. The market had been selling off over the last hour, but was attempting to correct getting stuck between the 50 SMA and the S1 Pivot. With JOBB, your order would not have filled at any time, but follow the rules and cancel after about 15 sec of dull activity. It continued to chop sideways in a tight range between 92.80 and 92.93 until about 16 min after the report when it finally broke out short.

CL 04-13 (1 Min) 2.21.2013

 Philly FED Manufacturing Index  Comments Off on CL 04-13 (1 Min) 2.21.2013
May 182013
 

CL 04-13 (1 Min)  2_21_2013

2/21/2013 Monthly Philly FED Manufacturing Index (1000 EST)
Forecast: 1.1
Actual: -12.5
Previous revision: n/a
SPIKE/REVERSE
Started @ 92.82
1st Peak @ 92.70 – 1001 (1 min)
12 ticks

Reversal to 93.05 – 1009 (9 min)
35 ticks

Notes: Report strongly fell short of the forecast with a delta of nearly 14, but this caused a much smaller than expected short spike of only 12 ticks that was unsustainable. The market had been selling off over the last 2 hours mostly due to disappointing jobless claims, and was likely oversold. The spike did not cross any SMAs or Pivots, but made a failed attempt to reach the LOD that was established just 10 min earlier. With JOBB, your order would have filled short at about 93.75 with 2 ticks of slippage. Then it stayed stuck between 93.73 and 93.70, so close out with a few ticks. After the spike, it struggled to reverse through the 20 and 13 SMAs and eventually nicked the 50 SMA for 35 ticks 9 min after the report. After that, it attempted a 2nd peak, but came up short, then rebounded further.

CL 02 13 (1 Min) 01.17.13

 Philly FED Manufacturing Index  Comments Off on CL 02 13 (1 Min) 01.17.13
Jan 172013


CL 02 13 (1 Min) 01.17.13

1/17/2012 Monthly Philly FED Manufacturing Index (1000 EST)
Forecast: 7.1
Actual: -5.8
Previous revision: n/a
SPIKE/REVERSE
Started @ 95.40
1st Peak @ 95.30 – 1001 (1 min)
10 ticks

Reversal to 95.71 – 1016 (16 min)
41 ticks

Notes: Report strongly fell short of the forecast with a delta of nearly 13, but this caused a much smaller than expected short spike of only 10 ticks. The market had been rallying over the last few hours, but was not ready to sell yet. The spike hit the 50 SMA, and could go no lower. With JOBB, your order would have filled at 95.32 with 1 tick of slippage. Since it never fell below the 50 SMA, look to get out at break even. The reversal achieved 41 ticks in 15 min to extend the HOD another 20 ticks.

CL 01 13 (1 Min) 11.15.12

 Philly FED Manufacturing Index  Comments Off on CL 01 13 (1 Min) 11.15.12
Nov 152012


CL 01 13 (1 Min) 11.15.12

11/15/2012 Monthly Philly FED Manufacturing Index (0500 HI time / 1000 EST)
Forecast: 1.1
Actual: -10.7
Previous revision: n/a
SPIKE WITH 2ND PEAK
Started @ 86.67
1st Peak @ 86.29 – 0502 (2 min)
38 ticks

Reversal to 86.77 – 0508 (8 min)
48 ticks

2nd Peak @ 86.20 – 0522 (22 min)
47 ticks

Reversal to 86.59 – 0552 (52 min)
39 ticks

Notes: Report strongly fell short of the forecast, causing a short move of 38 ticks over 2 bars. With the short move in the previous 30 min hitting the LOD, then seeing a gap close correction to the 13 SMA prior to the report, the bearish report was prime to drop. It tested the PP Pivot and LOD on the :31 bar, and dipped about 12 ticks below it on the :32 bar. Unable to sustain the drop, it reversed strongly for 48 ticks 6 min later, then dove for a 2nd peak of 47 ticks. With JOBB, your order would have filled at 86.59 with 2 ticks of slippage. I would place a buy limit order between the LOD and the PP Pivot at about 86.43 which would have yielded 16 ticks. The final reversal yielded 39 ticks, peaking just before the Oil inventory report.

CL 11 12 (1 Min) 10.18.12

 Philly FED Manufacturing Index  Comments Off on CL 11 12 (1 Min) 10.18.12
Oct 182012


CL 11 12 (1 Min) 10.18.12

10/18/2012 Monthly Philly FED Manufacturing Index (0400 HI time / 1000 EDT)
Forecast: 1.3
Actual: 5.7
Previous revision: n/a
SPIKE/REVERSE
Started @ 91.11
1st Peak @ 91.21 – 0402 (2 min)
10 ticks

Reversal to 90.71 – 0409 (9 min)
50 ticks

Notes: Report barely exceeded the forecast, causing a nearly dull reaction of 10 ticks. With JOBB, your order would have filled at 91.18 then hovered 2-3 ticks on either side of your fill. With the 100 SMA containing it above, it could go no higher than 91.21. Close out around breakeven before it reverses. The reversal took over strongly on the :02 bar, crossing the 50 SMA and the S2 Pivot, eventually yielding 50 ticks about 8 min to nearly match the low achieved about 1 hr earlier.

CL 11 12 (1 Min) 09.20.12

 Philly FED Manufacturing Index  Comments Off on CL 11 12 (1 Min) 09.20.12
Sep 202012


CL 11 12 (1 Min) 09.20.12

9/20/2012 Monthly Philly FED Manufacturing Index (0400 HI time / 1000 EDT)
Forecast: -4.1
Actual: -1.9
Previous revision: n/a
SPIKE WITH 2ND PEAK
Started @ 91.74
1st Peak @ 92.03 – 0402 (2 min)
29 ticks

2nd Peak @ 92.37 – 0407 (7 min)
63 ticks

Reversal to 91.86 – 0424 (24 min)
51 ticks

Notes: Report barely exceeded the forecast, and yet it drew a large spike and 2nd Peak. In contrast to last month with about the same forecast to actual offset, we got a large reaction instead of a dull one. With JOBB, your order would have filled long at about 91.80 with no slippage, then the safe approach would be to close out at the 200 SMA where it encountered resistance on the :01 bar. If you stayed in, the end of the :02 bar would have given you another 14 ticks after crossing all 3 SMAs. The next bar was flat before the 2nd peak yielded another 34 ticks in 4 bars. With a sharp rise of 63 ticks on a barely positive report, this would be a good opportunity to trade the reversal as it is overbought in the very short term. It initially dropped 30 ticks, then made another attempt to break through the 92.35 area. After failing, it fell for 51 ticks to eclipse the 200 and 100 SMAs.

CL 10 12 (1 Min) 08.16.12

 Philly FED Manufacturing Index  Comments Off on CL 10 12 (1 Min) 08.16.12
Aug 162012


CL 10 12 (1 Min) 08.16.12

8/16/2012 Monthly Philly FED Manufacturing Index (0400 HI time / 1000 EDT)
Forecast: -4.7
Actual: -7.1
Previous revision: n/a
DULL REACTION
Started @ 94.74
1st Peak @ 94.65 – 0401 (1 min)
9 ticks

Reversal to 94.82 – 0402 (2 min)
17 ticks

Notes: Report barely fell short of the forecast, causing a dull reaction. With JOBB, your order would not have filled until about 37 sec into the :31 bar, but close out after 10 or so seconds without a fill. It could only drop 9 ticks, then shot upward for 17 ticks from the low point to cross the 50 and 200 SMAs. Finding resistance there, it fell again. Then it eventually went long in the next hour, but that cannot be attributed to the report.

CL 09 12 (1 Min) 07.19.12

 Philly FED Manufacturing Index  Comments Off on CL 09 12 (1 Min) 07.19.12
Jul 192012


CL 09 12 (1 Min) 07.19.12

7/19/2012 Monthly Philly FED Manufacturing Index (0400 HI time / 1000 EDT)
Forecast: -7.9
Actual: -12.9
Previous revision: n/a
SPIKE WITH 2ND PEAK
Started @ 92.03
1st Peak @ 91.65 – 0403 (3 min)
38 ticks

Reversal to 91.89 – 0405 (5 min)
24 ticks

2nd Peak @ 91.60 – 0414 (14 min)
43 ticks

Reversal to 92.04 – 0431 (31 min)
44 ticks

Notes: Report fell moderately short of the forecast causing a healthy short spike, that eclipsed the 50 SMA. It then reversed for 24 ticks, bouncing off of the 50 SMA, but was able to carve out a 2nd peak for 5 more ticks to just above the 100 SMA before reversing for 44 ticks. The overall trend before the report was bullish, so even with a negative report, the reversal reclaimed all of the drop from the initial reaction. Then the market continued higher in the long run. With JOBB this would have been a great setup to take at least 12 ticks on the :01 bar and at least 20 if you rode it to the 50 SMA.