4/13/2016 Monthly Retail Sales (0830 EDT)
Core Forecast: 0.4%
Core Actual: 0.2%
Previous revision: +0.1% to 0.0%
Regular Forecast: 0.1%
Regular Actual: -0.3%
Previous Revision: +0.1% to 0.0%
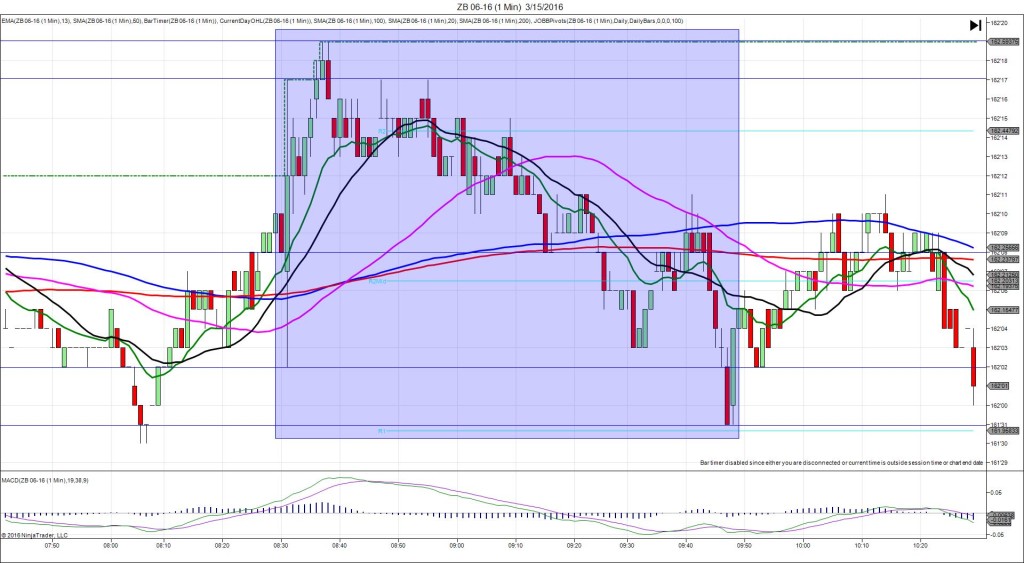
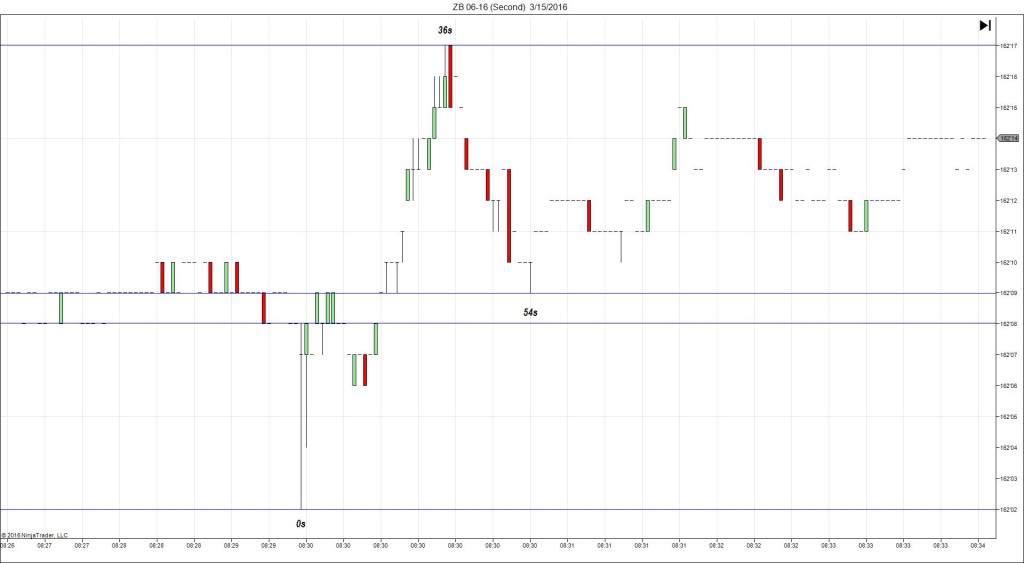
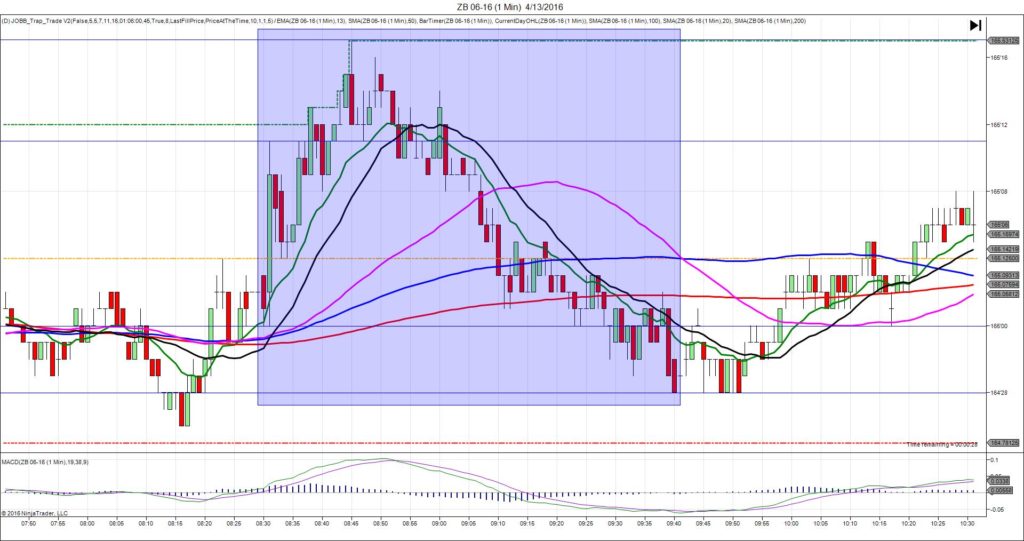
SPIKE WITH 2ND PEAK
Started @ 165’00
1st Peak @ 165’11 – 0830:12 (1 min)
11 ticks
Reversal to 165’04 – 0833 (3 min)
7 ticks
2nd Peak @ 165’17 – 0845 (15 min)
17 ticks
Reversal to 164’28 – 0940 (70 min)
21 ticks
Expected Fill: 165’04 (long)
Slippage: 1 tick
Best Initial Exit: 165’10 – 6 ticks
Recommended Profit Target placement: 165’10 (just above the PP Pivot) or 165’12 (on the HOD) – move lower
Notes: With all the results bearish and the PPI also in agreement, we saw a nice stable long spike of 11 ticks that climbed and hovered in between the PP Pivot and HOD. Look to exit at 165’09 or 10 with the hovering. After a 7 tick reversal it climbed to a 2nd peak of 6 more ticks in 14 min to eclipse the R1 Mid Pivot. Then it reversed 21 ticks in about an hour.