9/5/2014 Monthly Unemployment Report (0830 EDT)
Non Farm Jobs Forecast: 226K
Non Farm Jobs Actual: 142K
Previous Revision: +3K to 212K
Rate Forecast: 6.1%
Rate Actual: 6.1%
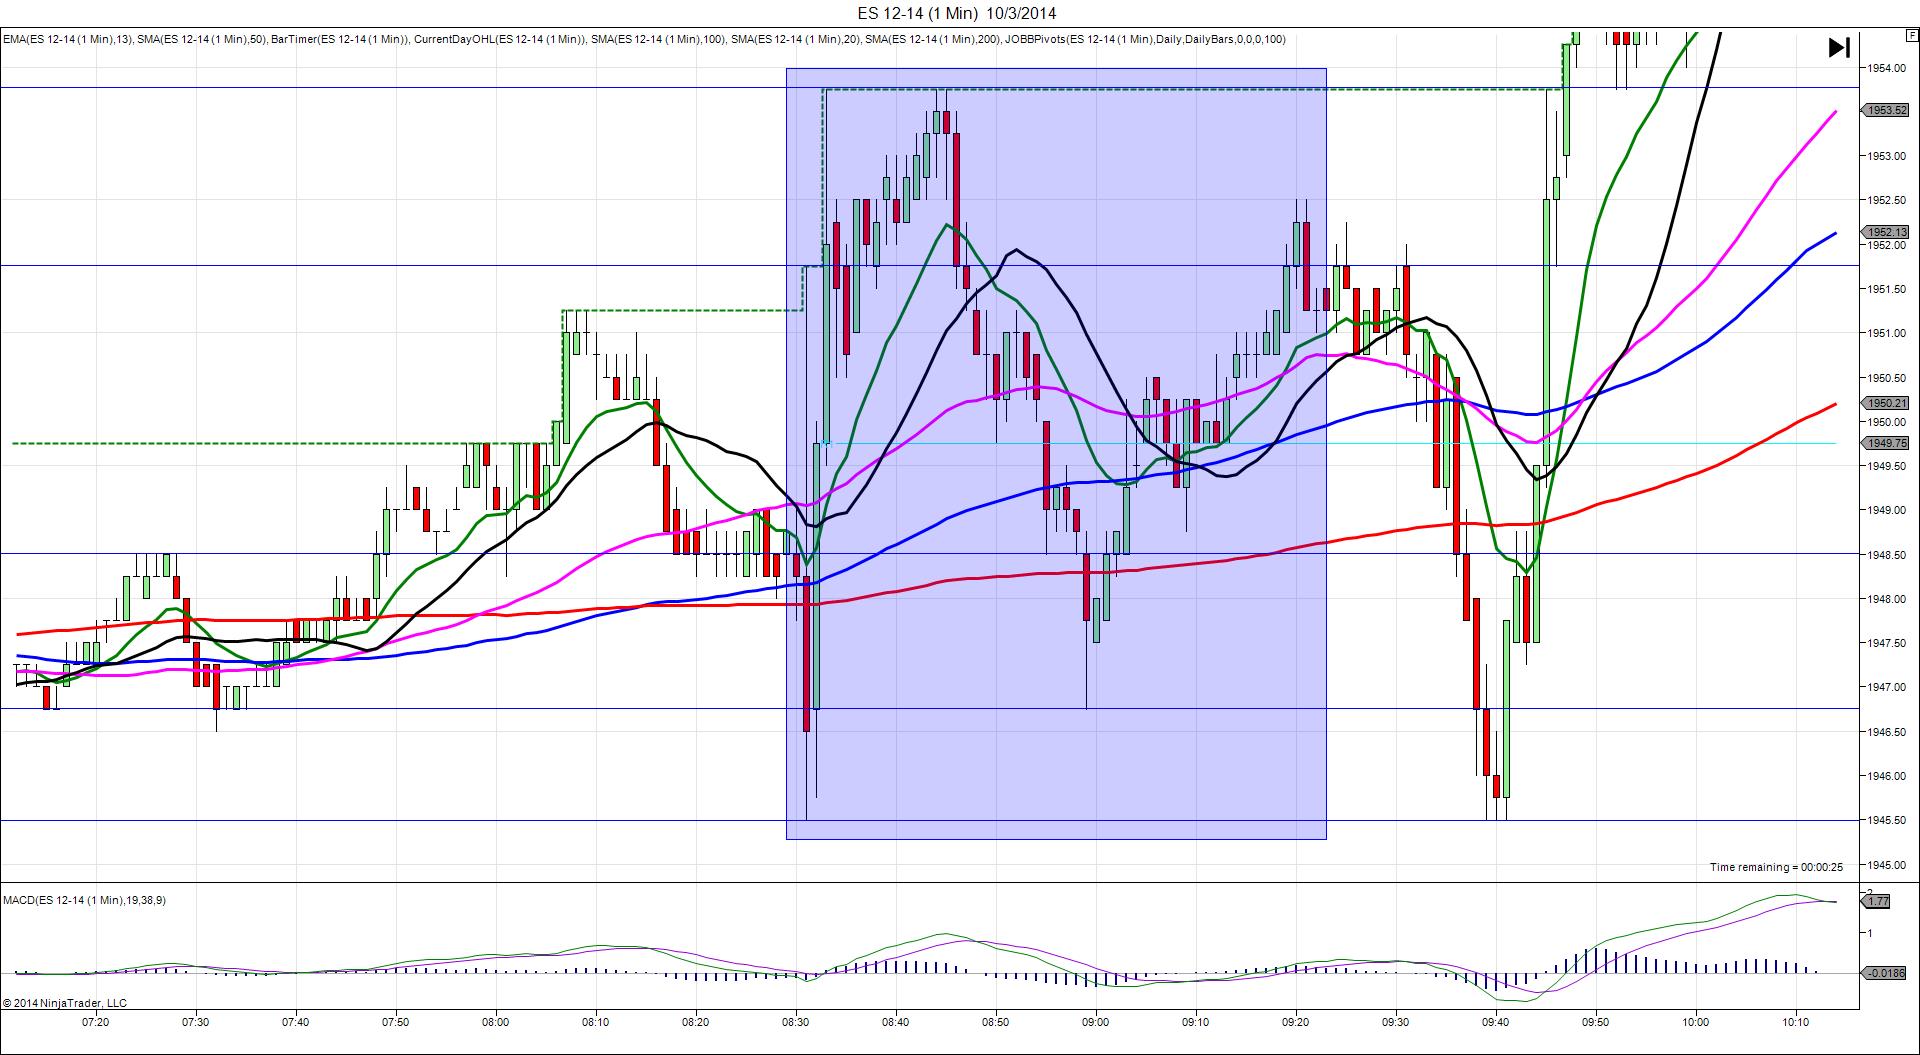
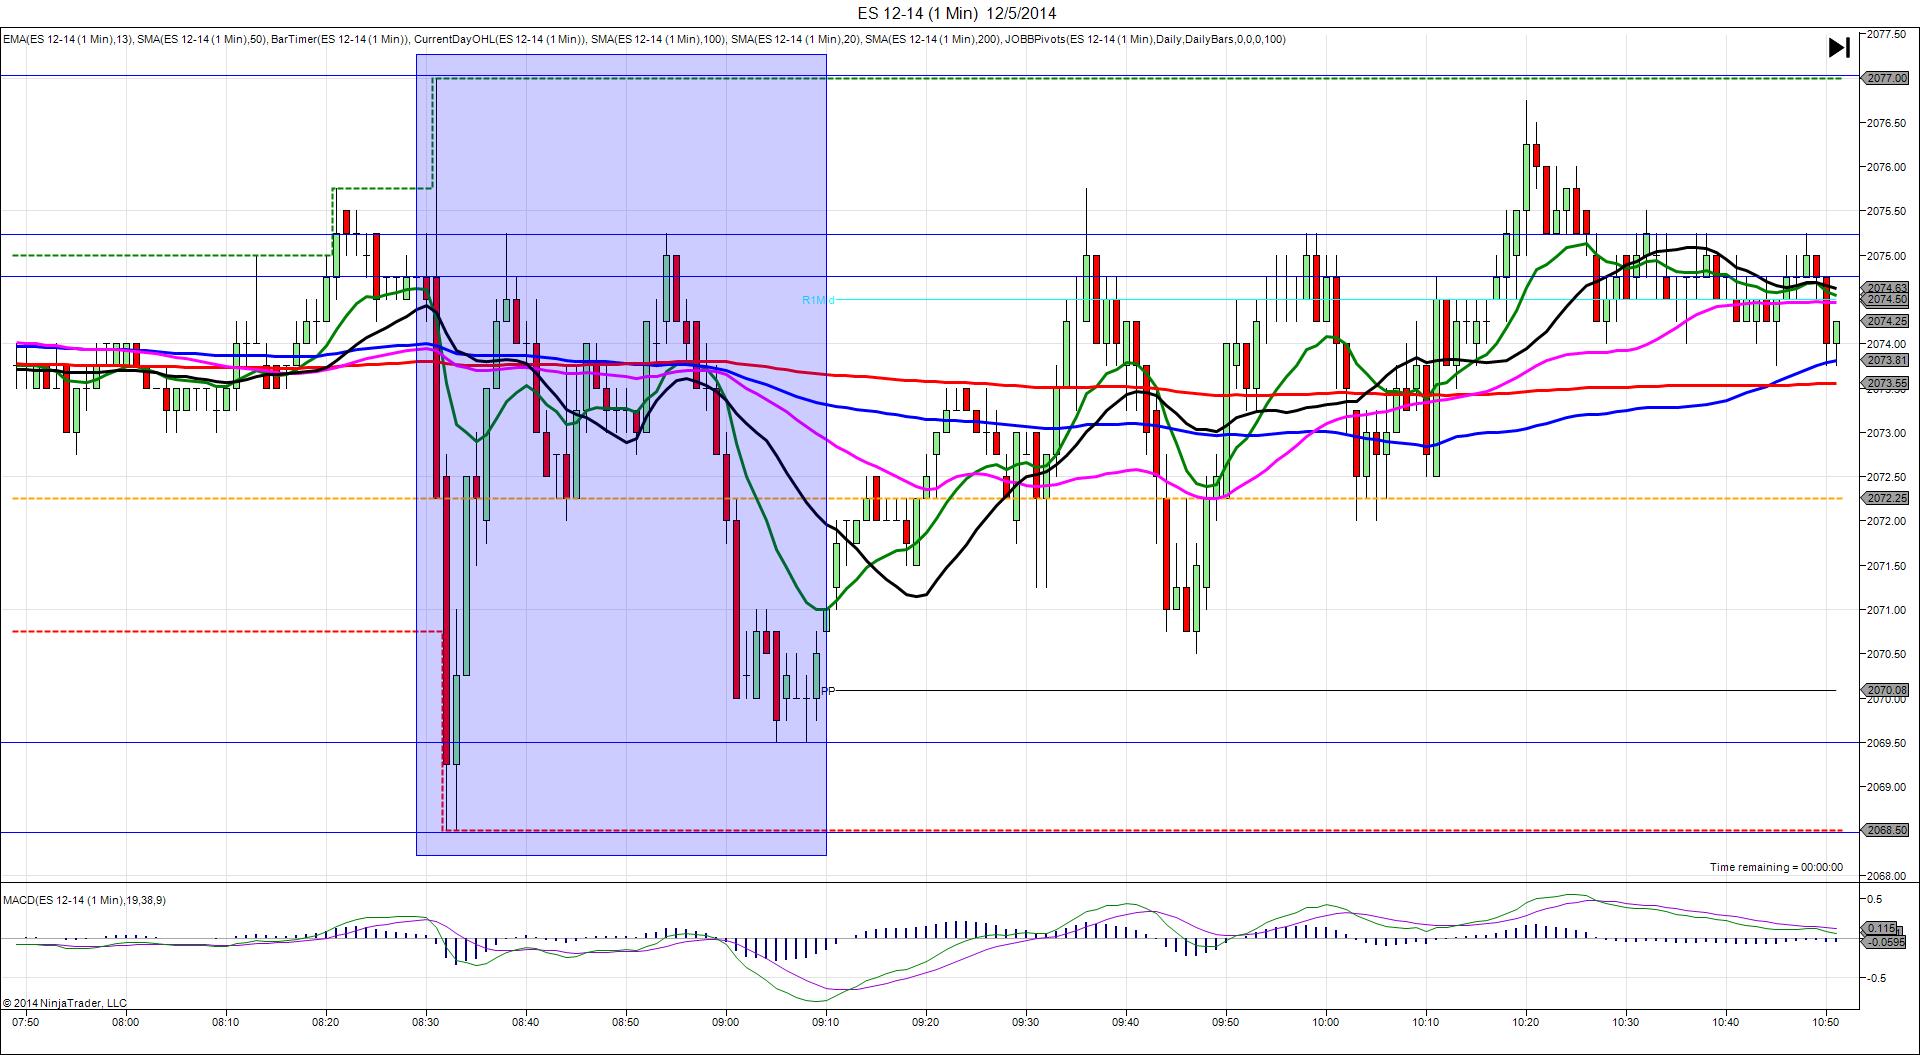
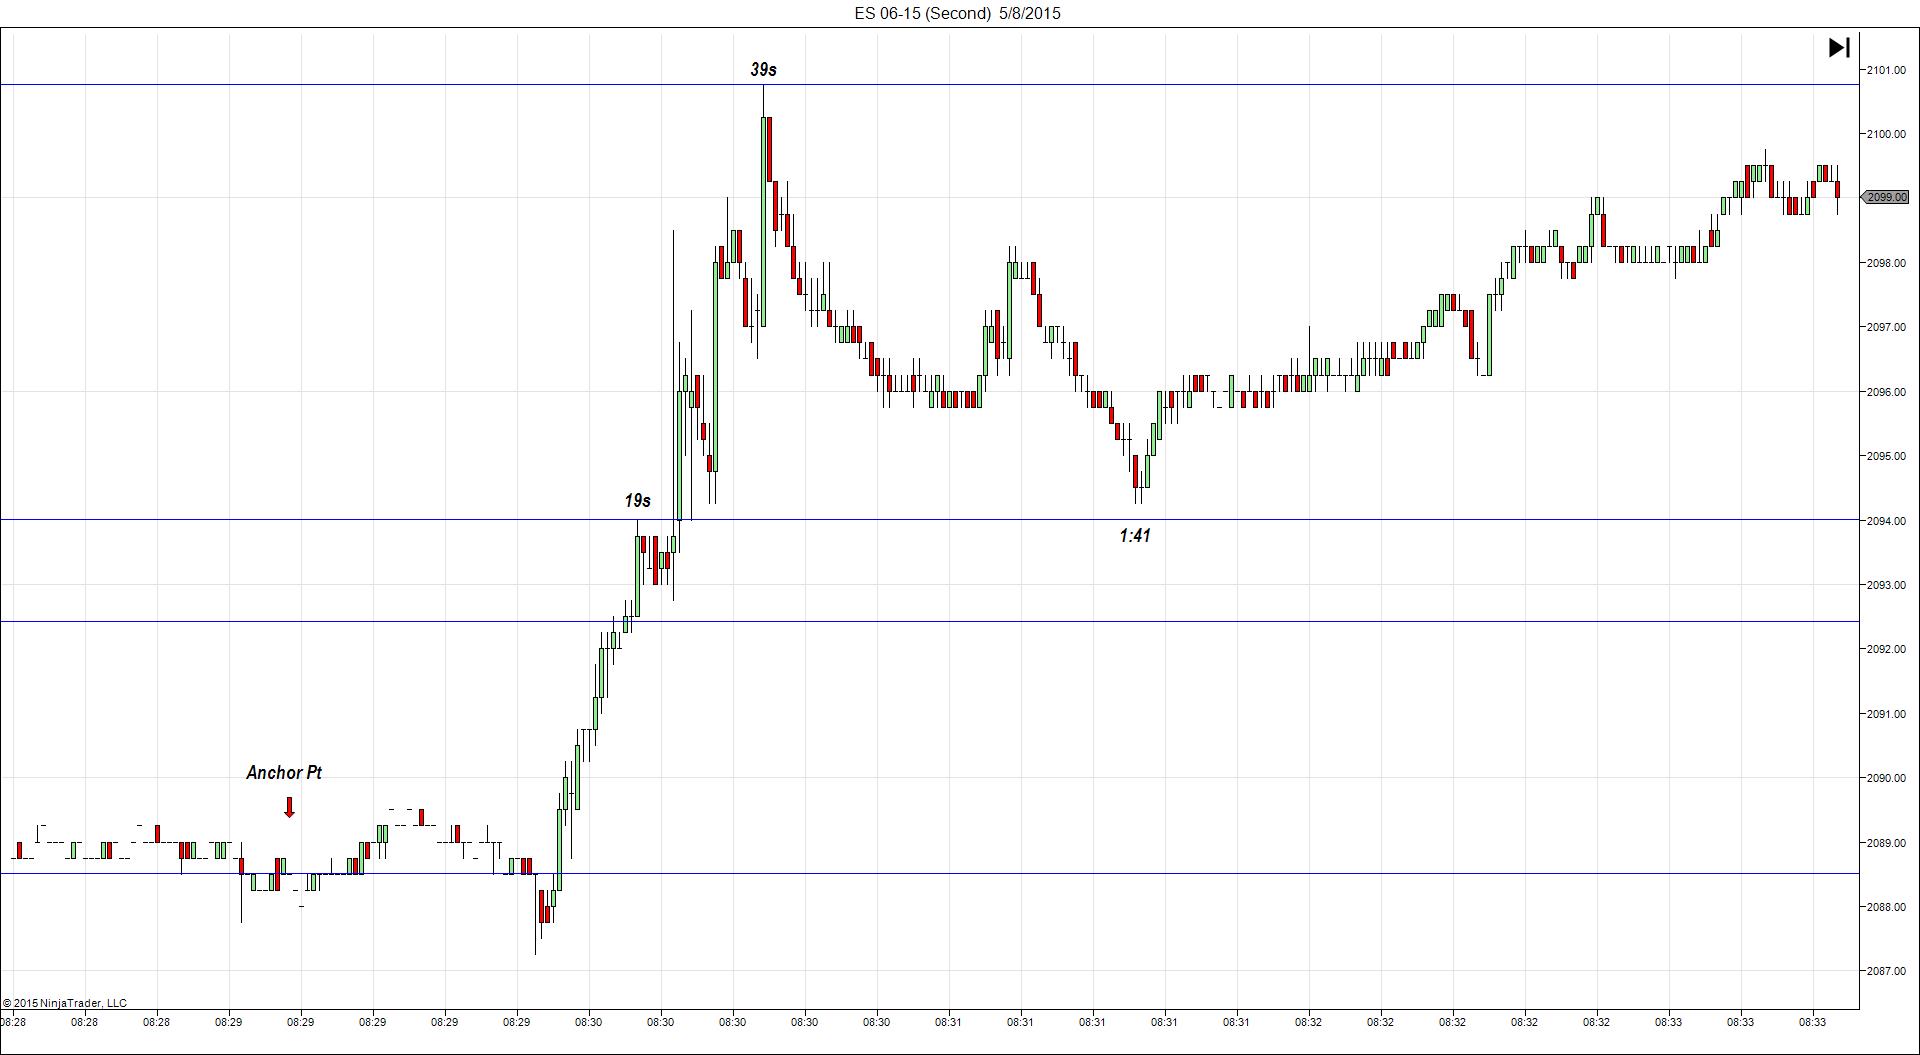
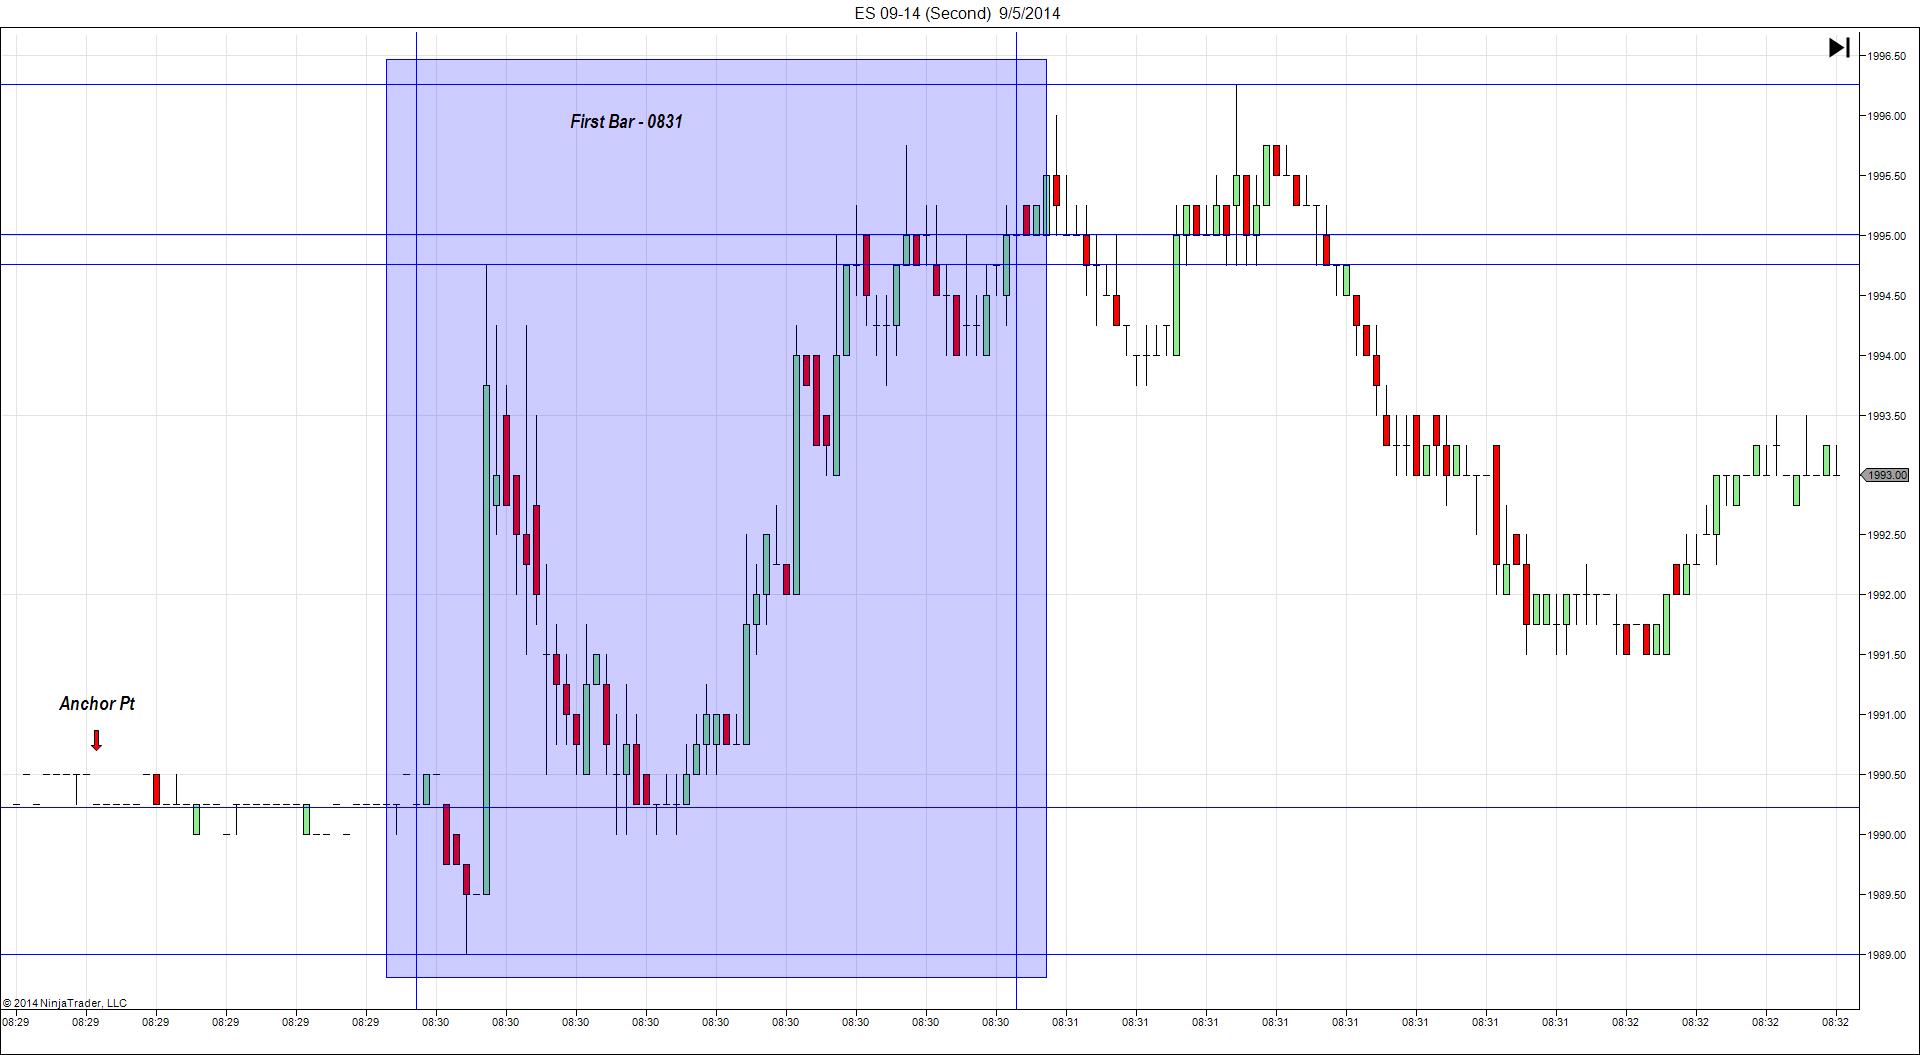
TRAP TRADE – DULL NO FILL (SPIKE WITH 2ND PEAK)
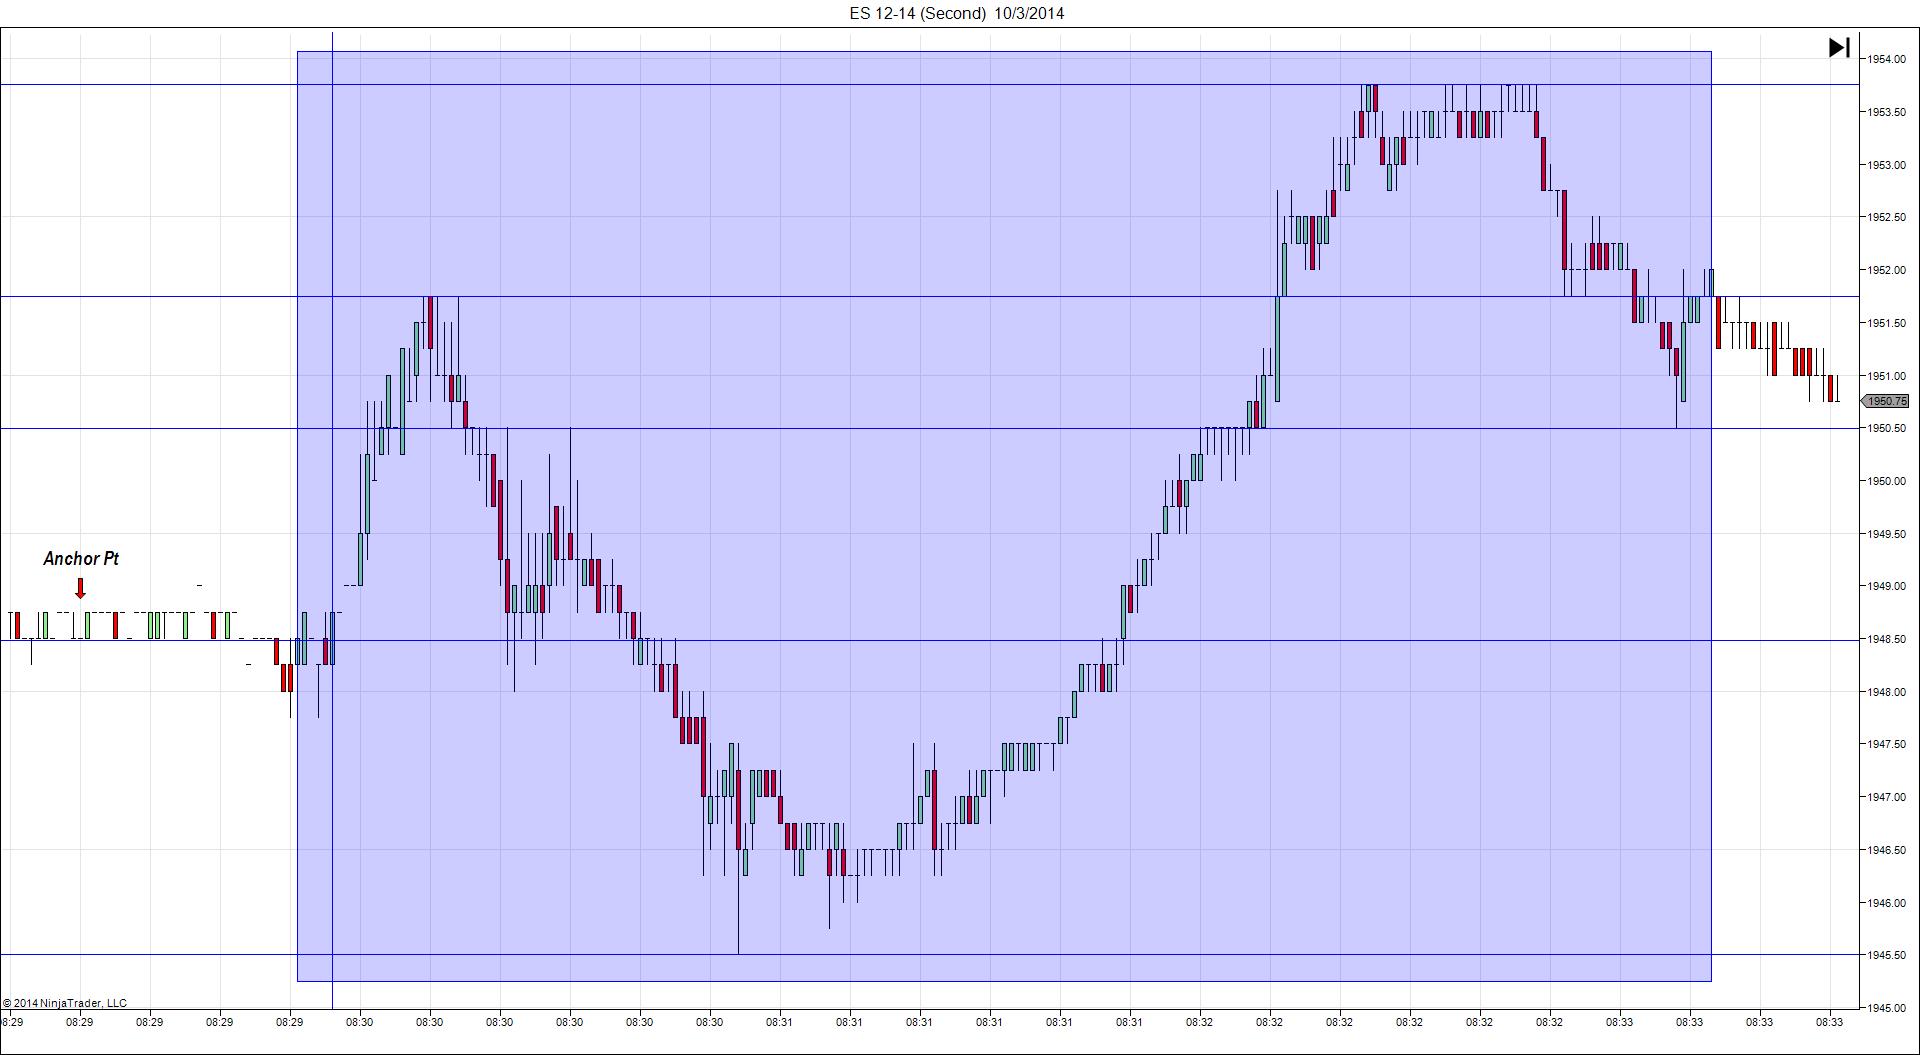
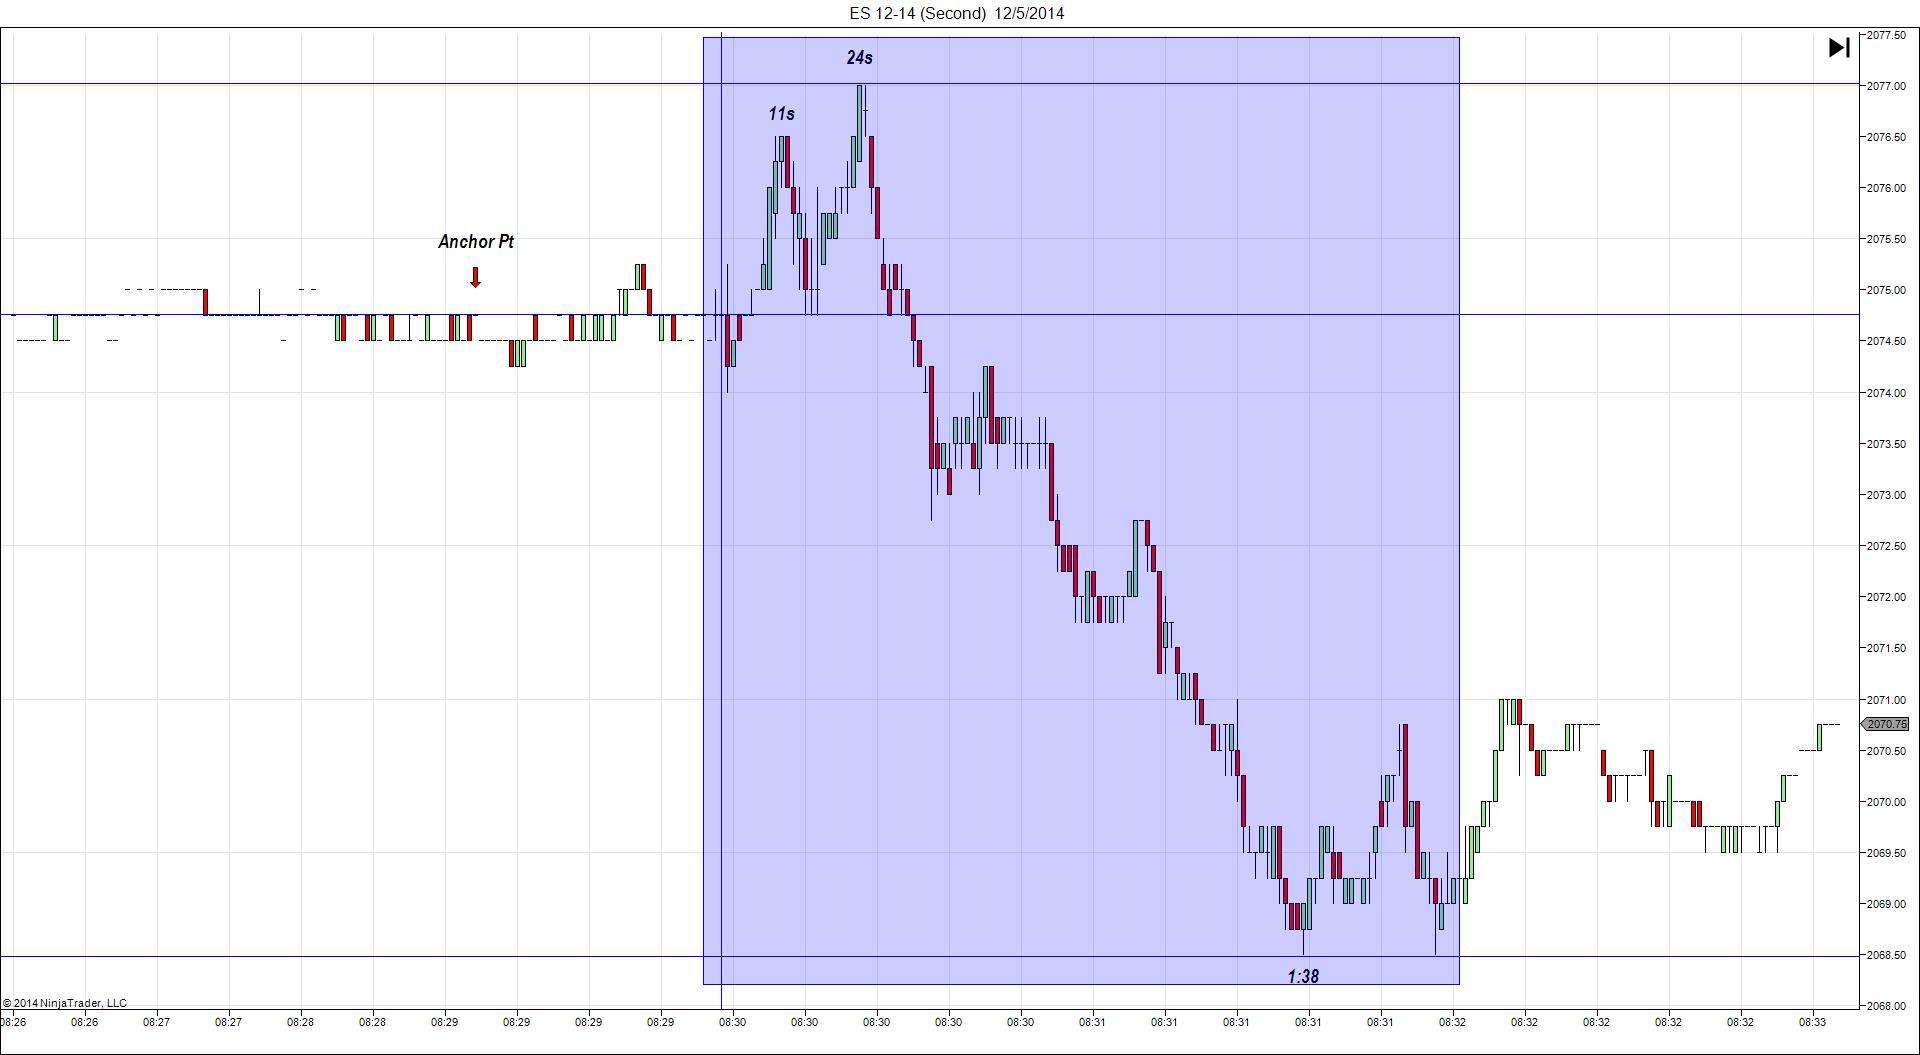
Anchor Point @ 1990.25 (last price)
————
Trap Trade:
)))1st Peak @ 1994.75 – 0830:07 (1 min)
)))18 ticks
)))Reversal to 1990.00 – 0830:20 (1 min)
)))-19 ticks
)))Pullback to 1996.25 – 0831:22 (2 min)
)))25 ticks
)))Reversal to 1991.50 – 0831:51 (2 min)
)))-19 ticks
————
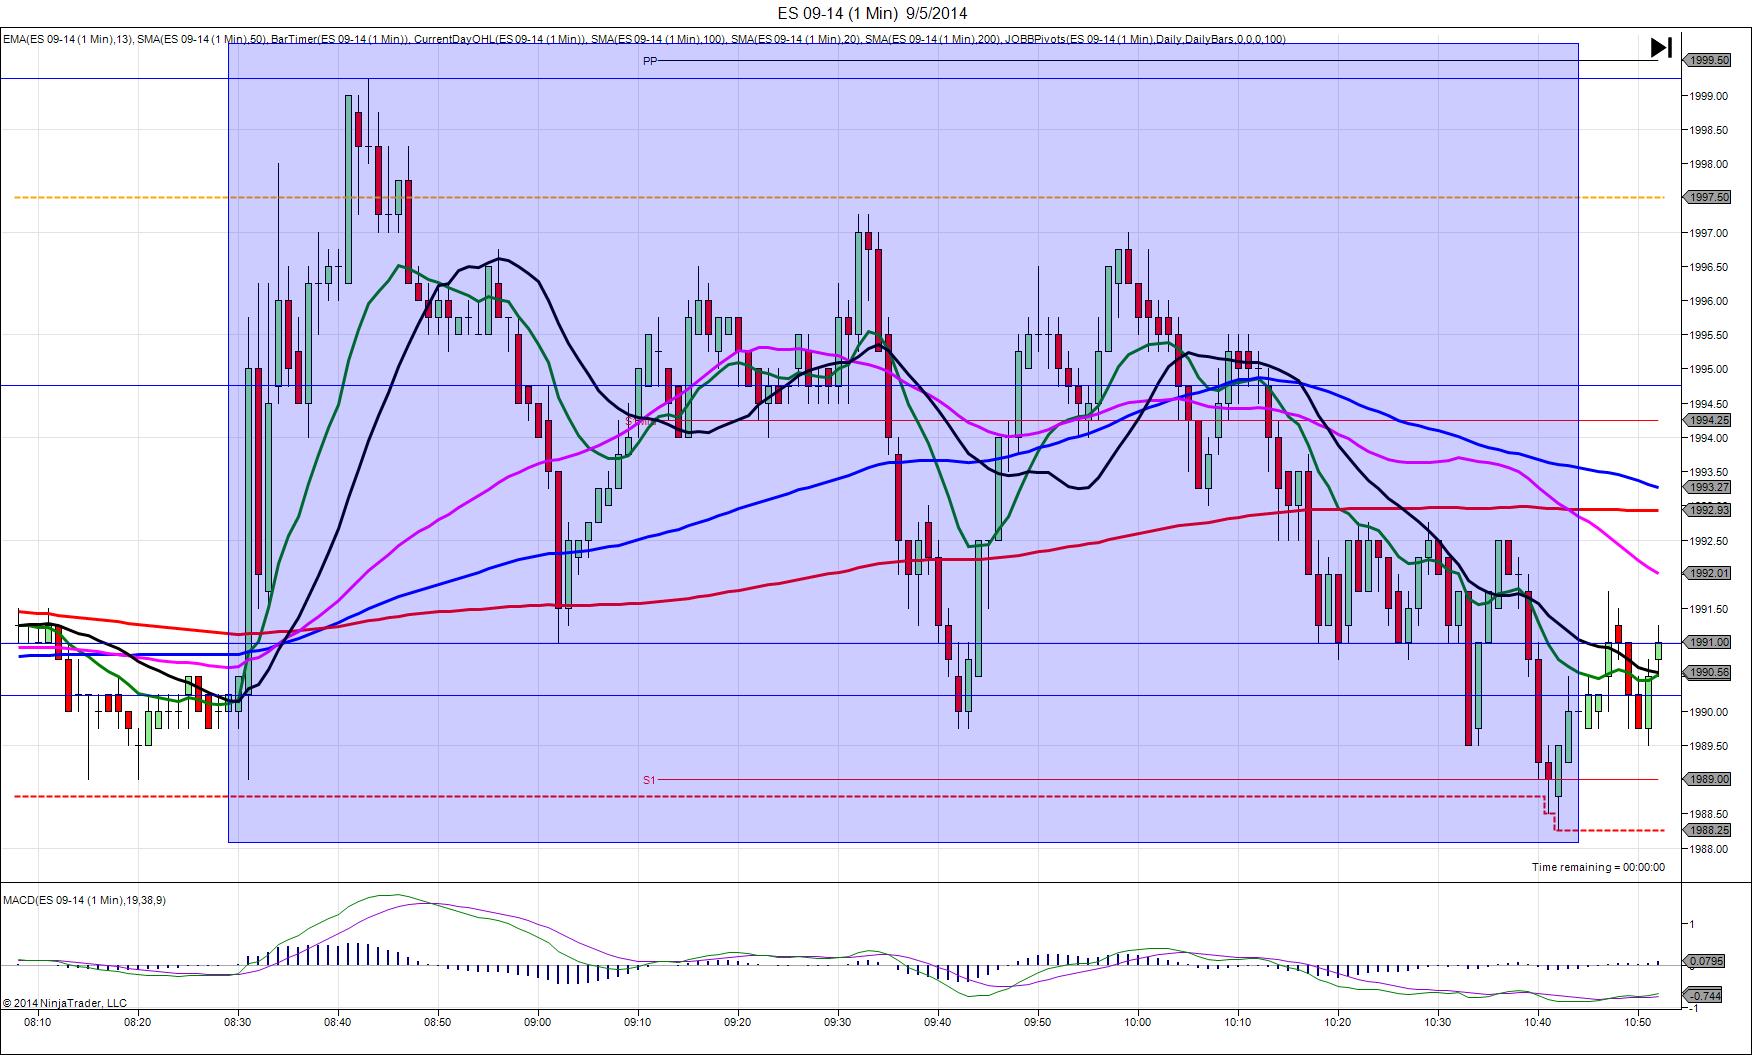
Final Peak @ 1999.25 – 0843 (13 min)
36 ticks
Reversal to 1991.00 – 0902 (32 min)
33 ticks
Trap Trade Bracket setup:
Long entries – 1984.00 (just below the S2 Mid Pivot) / 1980.00 (just below the S2 Pivot)
Short entries – 1997.00 (just below the OOD) / 1999.75 (just above the PP Pivot)
Notes: Strongly negative report with 84K less jobs added than the forecast, a negligible upward revision to the previous report and a match on the U-3 rate of 6.1%. We saw a long spike of only 18 ticks in the first 7 sec then choppy trading between the peak and just above the 200 SMA for a few sec before a reversal to the origin in the next 10 sec. Then it rebounded for 25 ticks in the next minute. This would have fallen about 8-9 ticks short of the inner short order and it did not offer a great opportunity to manually move the order in closer. However we see the trend after the first 2 bars is to swing between the 1990 – 1991 area and the area around 1996 – 1998 so buying at the bottom and selling at the top each time would have been safe and profitable. The 0843 bar is a bearish indicator (shooting star) and a great short opportunity. It kept swinging until the final reversal ended at 1042, then rallied until the close as the results were interpreted to keep the FED in a dovish mood.