CL 06-13 (1 Min) 5.8.2013

 Oil Inventory  Comments Off on CL 06-13 (1 Min) 5.8.2013
May 212013
 

CL 06-13 (1 Min)  5_8_2013

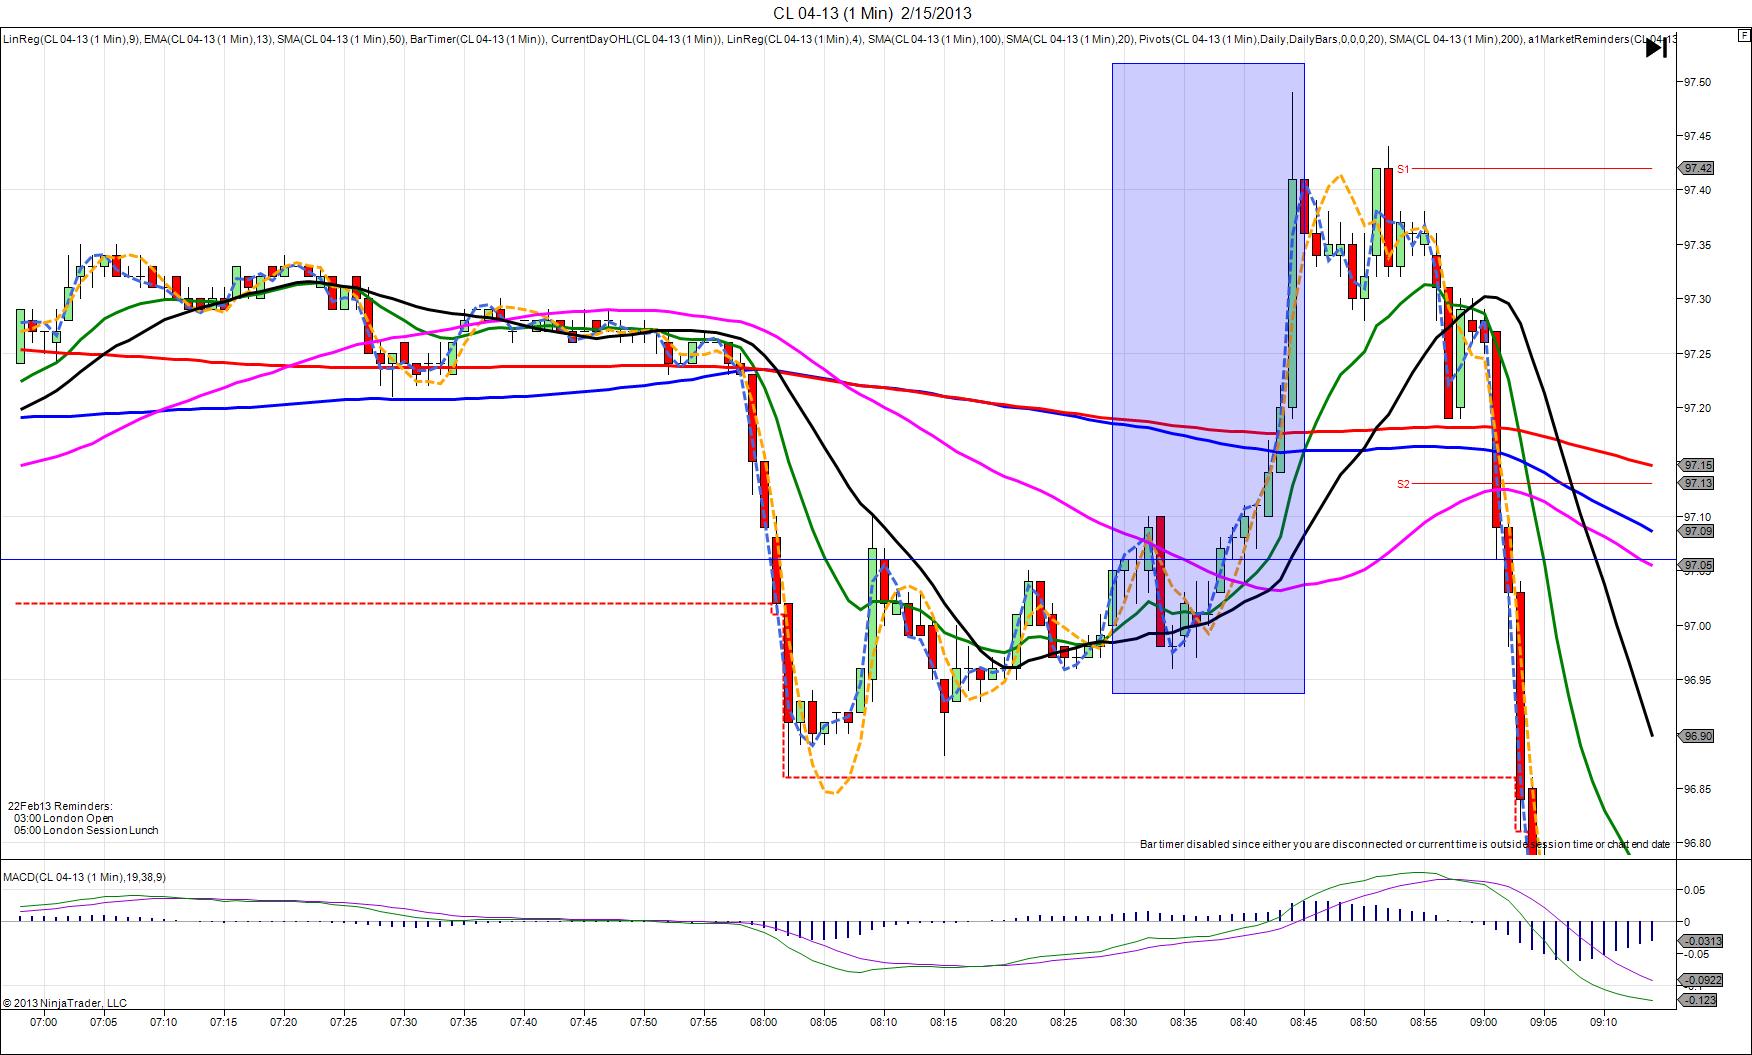
5/8/2013 Weekly Crude Oil Inventory Report (1030 EDT)
Forecast: 2.1M
Actual: 0.2M
SPIKE/REVERSE
Started @ 96.16
1st Peak @ 96.36 – 1032 (2 min)
20 ticks

Reversal to 95.81 – 1041 (11 min)
55 ticks

Notes: Little change in crude inventories when a small gain was expected, while gasoline saw a small draw and distillates saw a moderate gain. Commercial oil inventories continue to be categorized as above their upper limit and reached a new record. This caused a long move of 20 ticks that eclipsed the 50 and 20 SMAs, and the R1 Pivot, peaking on the :32 bar. With JOBB and a 10 tick buffer, you would have filled long at about 96.27 with 1 tick of slippage, then seen it reverse and bounce between breakeven and 17 ticks in the red. Look to exit within 5 ticks of breakeven at or below the 50 SMA with a limit order. The :32 bar gave a few more ticks before the reversal began. In a volatile and choppy manner, it fell for 55 ticks in 11 min to eclipse the 200 SMA and OOD. After that it chopped sideways between the OOD and R1 Pivot.

ZB 06-13 (1 Min) 5.9.2013

 30y Bond Auction  Comments Off on ZB 06-13 (1 Min) 5.9.2013
May 202013
 

ZB 06-13 (1 Min)  5_9_2013

5/9/2013 30-yr Bond Auction (1301 EST)
Previous: 3.00/2.5
Actual: 2.98/2.5
SPIKE WITH 2ND PEAK
Started @ 146’29 (1301)
1st Peak @ 147’10 – 1305 (4 min)
13 ticks

Reversal to 147’04 – 1309 (8 min)
6 ticks

2nd Peak @ 147’12 – 1315 (14 min)
15 ticks

Reversal to 146’14 – 1456 (115 min)
30 ticks

Notes: Report is scheduled on Forex Factory at the bottom of the hour, but the spike always breaks 1 min late. The highest yield fell marginally compared to last month. This caused a 13 tick spike that crossed the R1 Pivot then eclipsed the R2 Mid Pivot for 13 ticks as it peaked on the :05 bar. With JOBB you would have filled long at 147’00 with no slippage, then look to exit at 147’07 at the R2 Mid Pivot for 7 ticks. After the peak, it reversed for 6 ticks back to the 13 SMA before climbing for a 2nd peak of 2 more ticks about 6 min later. Then it reversed strongly as the larger overbought sentiment caught up to it for 30 ticks in the next 100 min back to the LOD and S1 Mid Pivot riding the 20 SMA as resistance as it stepped lower.

ZB 06-13 (1 Min) 5.8.2013

 10y Bond Auction  Comments Off on ZB 06-13 (1 Min) 5.8.2013
May 202013
 

ZB 06-13 (1 Min)  5_8_2013

5/8/2013 10-yr Bond Auction (1301 EDT)
Previous: 1.80/2.8
Actual: 1.81/2.7
SPIKE WITH 2ND PEAK
Started @ 146’27 (1301)
1st Peak @ 146’20 – 1302 (1 min)
7 ticks

2nd Peak @ 146’17 – 1308 (7 min)
10 ticks

Reversal to 146’24 – 1315 (14 min)
7 ticks

Notes: Report is scheduled on Forex Factory at the top of the hour, but the spike always breaks 1+ min late. The highest yield rose marginally from the previous auction. This caused the ZB to spike short for 7 ticks as it crossed the 50/100 SMAs near the origin then eclipsed the 200 SMA and stalled briefly. With JOBB you would fill short at 146’23 with 1 tick of slippage. With the 200 SMA, look to exit at 146’21 or 20 with 2-3 ticks. It achieved 3 more ticks for a quick 2nd peak in 6 more min to eclipse the R2 Mid Pivot, then reversed for 7 ticks to nearly reach the 100 SMA. After that, it fell again but could not conquer the R2 Mid Pivot, and rebounded.

CL 06-13 (1 Min) 5.3.2013

 ISM Non-Manufacturing PMI  Comments Off on CL 06-13 (1 Min) 5.3.2013
May 192013
 

CL 06-13 (1 Min)  5_3_2013

5/3/2013 Monthly ISM Non-Manufacturing PMI (1000 EDT)
Forecast: 54.1
Actual: 53.1
Previous Revision: n/a
SPIKE/REVERSE
Started @ 95.18
1st Peak @ 94.89 – 1003 (3 min)
29 ticks

Reversal to 95.38 – 1012 (12 min)
49 ticks

Notes: Moderately negative report fell short of the forecast by 1 point. This caused a short spike of 29 ticks on 2 bars as it crossed the 100/50 SMAs and the R1 Pivot. With JOBB, you would have filled short at 95.12 with 2 ticks of slippage, then had an opportunity to exit with 13 ticks at 94.99 on the R1 Pivot. After the initial peak it chopped sideways for 4 min, then reversed upward to get wrapped up in the rally caused by the positive Non Farm report from 90 min earlier. It found resistance at the 95.35 area, but was able to capture a few more ticks about 10 min after the 1st peak. After that it trended higher.

CL 06-13 (1 Min) 4.15.2013

 Empire State Manufacturing Index  Comments Off on CL 06-13 (1 Min) 4.15.2013
May 192013
 

CL 06-13 (1 Min)  4_15_2013

4/15/2013 Monthly Empire State Manufacturing Index (0830 EDT)
Forecast: 7.2
Actual: 3.1
INDECISIVE
Started @ 90.07
1st Peak @ 90.00 – 0831 (1 min)
7 ticks

Reversal to 90.16 – 0831 (1 min)
-16 ticks

2nd peak @ 89.80 – 0832 (2 min)
27 ticks

Notes: Report fell mildly short of the forecast and disappointed the market. We saw an initial short move of 7 ticks, then a quick reversal of 16 ticks, followed by a 27 tick 2nd peak on the :32 bar. Since the market was strongly in a bullish rally for the 2.5 hrs before the report gaining about 200 ticks, it was a bit jittery near the top as it had just started to back off of the HOD. It bounced off of support at the 20 SMA and briefly popped up, before falling to the 50 SMA. With JOBB, you would have filled short at 90.02 with 1 tick of slippage, then been stopped at 90.12 with 2 ticks of slippage. After the first few min, it chopped sideways unable to fall below the 20 SMA. Then it finally challenged the larger SMAs and fell about 30 min after the report. This was likely due to the divergence built up for a longer term correction, not the report.

CL 04-13 (1 Min) 2.15.2013

 Empire State Manufacturing Index  Comments Off on CL 04-13 (1 Min) 2.15.2013
May 192013
 

CL 04-13 (1 Min)  2_15_2013

2/15/2013 Monthly Empire State Manufacturing Index (0830 EST)
Forecast: -2.1
Actual: 10.0
DULL REACTION (NO FILL)
Started @ 97.06
1st Peak @ 97.02 – 0831 (1 min)
4 ticks

Notes: Report strongly exceeded the forecast. In spite of this, it is almost like the market was not paying attention as the 0831 bar only had a range of 5 ticks. This is a case with JOBB, where your order would not have filled. Close out your order after 15 sec without a spike. It is hard to day why this happened with strong bullish news, but occasionally the markets react or fail to react in the usual pattern. The delayed bullish run from 0834 to 0844 may have been due to the news, but it is hard to say.

CL 11-12 (1 Min) 9.17.2012

 Empire State Manufacturing Index  Comments Off on CL 11-12 (1 Min) 9.17.2012
May 192013
 

CL 11-12 (1 Min)  9_17_2012

9/17/2012 Monthly Empire State Manufacturing Index (0330 HI time / 0830 EST)
Forecast: -1.9%
Actual: -10.4%
DULL REACTION
Started @ 99.03
1st Peak @ 98.95 – 0231 (1 min)
8 ticks

Reversal to 99.10 – 0232 (2 min)
15 ticks

Notes: Report fell short of the forecast. This resulted in a dull reaction of only 8 ticks probably due to a key level of support at the 98.95 area. We see that area tested unsuccessfully a few times in the hour before the report. It crossed no SMAs or Pivots. With JOBB, you would have filled short at 98.97 with 1 tick of slippage. Then when it failed to go lower and hovered near breakeven, close out. The Reversal bounced back for 15 ticks to cross the 50 SMA and hit the 100 SMA, but was unable to sustain the gain and left most of the wick naked. Then after chopping sideways for a few minutes, it was able to rally for the following hour after the report influence wore off.

CL 06-13 (1 Min) 6.15.2012

 Empire State Manufacturing Index  Comments Off on CL 06-13 (1 Min) 6.15.2012
May 192013
 

CL 06-13 (1 Min)  6_15_2012

6/15/2012 Monthly Empire State Manufacturing Index (0830 EDT)
Forecast: 13.6%
Actual: 2.3%
SPIKE WITH 2ND PEAK
Started @ 87.86
1st Peak @ 87.72 – 0831 (1 min)
14 ticks

2nd Peak @ 87.66 – 0836 (6 min)
20 ticks

Reverse to 87.93 – 0846 (16 min)
27 ticks

Notes: Report fell well short of the forecast. The market was trending lower overall and had been correcting upward before the report. The 50 SMA was used as resistance to trigger the short move. The initial peak yielded 14 ticks just below the 20 SMA, then after 5 min of trading sideways, it fell for a 2nd peak of 20 ticks to match a low achieved twice in the past hour. Then it reversed back up to the 200 SMA for 27 ticks in 10 min.

CL 03-12 (1 Min) 2.15.2012

 Empire State Manufacturing Index  Comments Off on CL 03-12 (1 Min) 2.15.2012
May 192013
 

CL 03-12 (1 Min)  2_15_2012

2/15/2012 Monthly Empire State Manufacturing Index (0330 HI time / 0830 EST)
Forecast: 14.7%
Actual: 19.5%
SPIKE / REVERSE
Started @ 101.65
1st Peak @ 101.78 – 0331 (1 min)
13 ticks

Reversal to 101.63 – 0334 (4 min)
15 ticks

Notes: Report exceeded the forecast. The reaction was tempered by the 200 SMA. In this case, it popped up and quickly receded, so be quick on the trigger finger to close out with a few ticks.

CL 03-12 (1 Min) 1.17.2012

 Empire State Manufacturing Index  Comments Off on CL 03-12 (1 Min) 1.17.2012
May 192013
 

CL 03-12 (1 Min)  1_17_2012

1/17/2012 Monthly Empire State Manufacturing Index (0330 HI time / 0830 EST)
Forecast: 10.8%
Actual: 13.5%
SPIKE WITH 2ND PEAK
Started @ 100.79
1st Peak @ 100.89 – 0331 (1 min)
10 ticks

2nd Peak @ 101.06 – 0335 (5 min)
27 ticks

Retrace to 100.75 – 0339 – 0344 (9 – 14 min)
31 ticks (4x bottom)

Notes: Report exceeded the forecast. The reaction was strong and steady, briefly topping the 100 and 200 SMAs. Then it reversed to the price level right before the report release at the R3 Pivot. Eventually it fought through short, but no longer due to influence from this report.