
1/31/2013 Weekly Natural Gas Storage Report (1030 EST)
Forecast: -202B
Actual: -194B
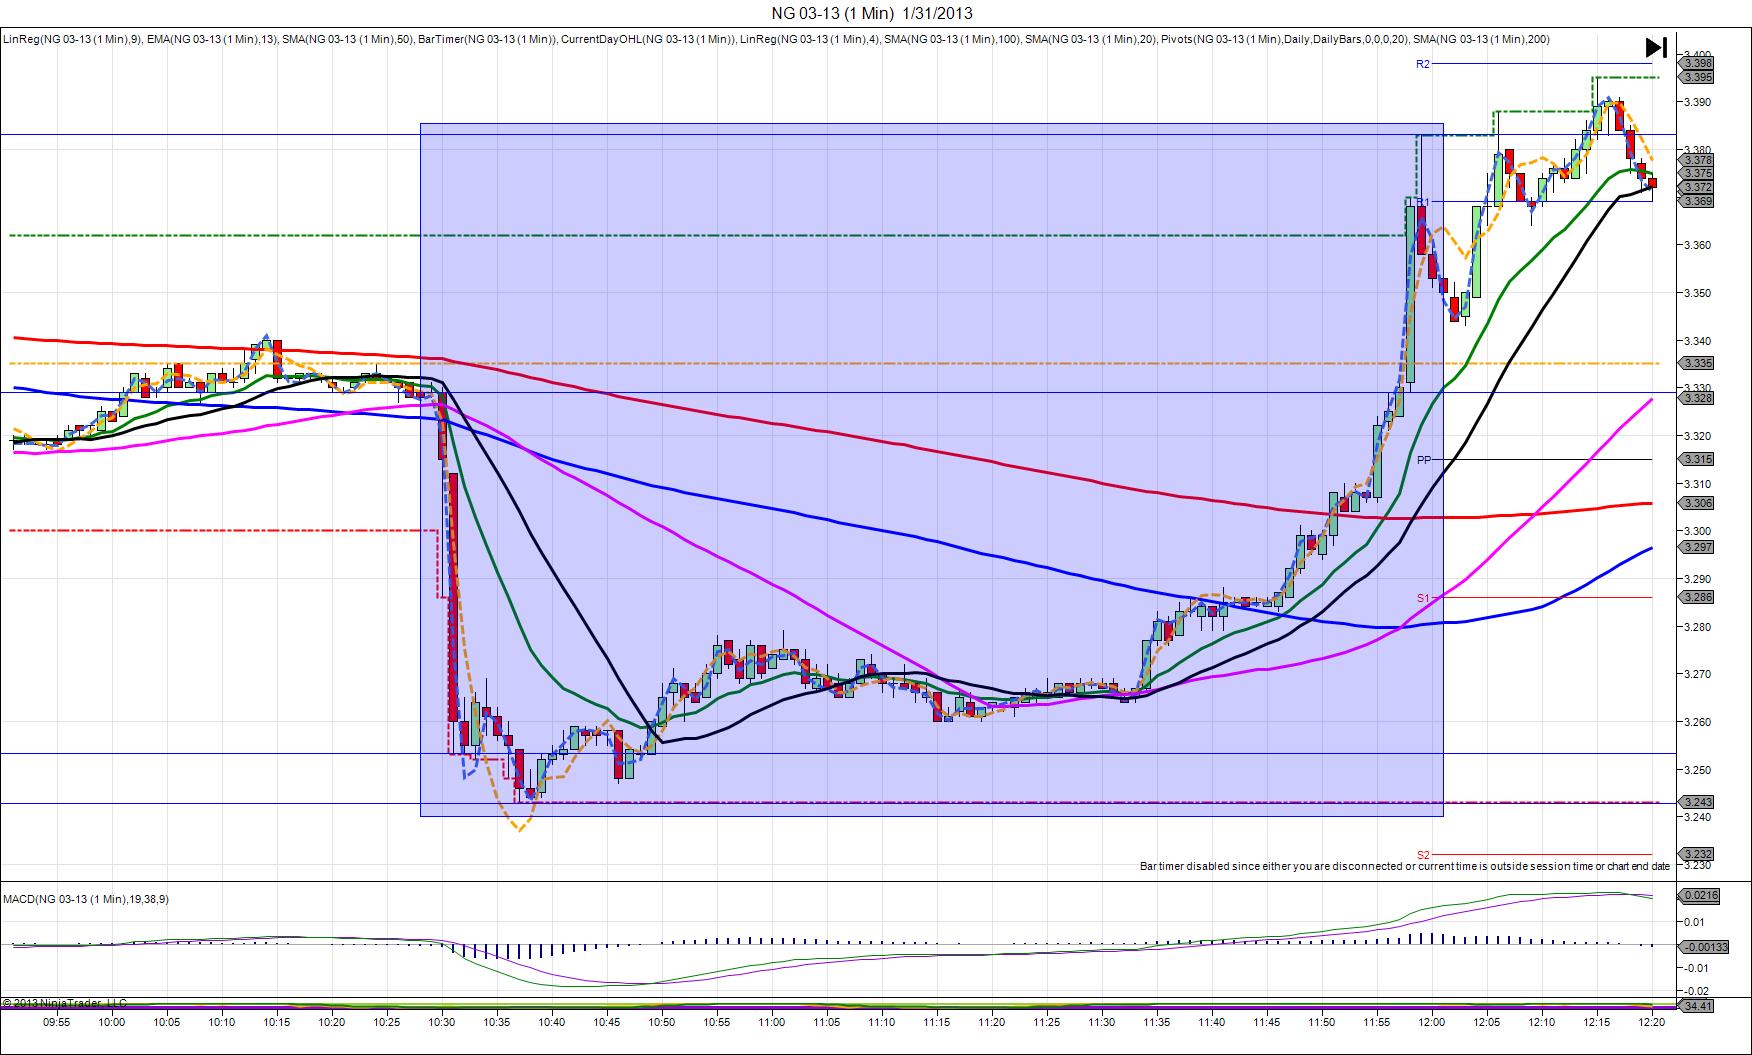
SPIKE WITH 2ND PEAK
Started @ 3.329
1st Peak @ 3.253 – 1031 (1 min)
76 ticks
Reversal to 3.269 – 1034 (4 min)
16 ticks
2nd Peak @ 3.243 – 1037 (7 min)
86 ticks
Reversal to 3.383 – 1159 (89 min)
140 ticks
Notes: Slightly smaller loss than was forecast caused a short spike of 76 ticks that crossed the 50 and 100 SMAs on top of each other and the PP / S1 Pivots. With JOBB, you would not have filled since the spike moved early on the :30 bar before the bracket was on the chart. After achieving the 1st peak, it reversed for a meager 16 ticks, then achieved a 2nd peak of only 10 more ticks in 7 min. The final reversal was slow developing, garnering 35 ticks in 18 min, then 105 more ticks in the next hour to eclipse the R1 Pivot.