3/13/2014 Monthly Retail Sales (0830 EDT)
Core Forecast: 0.2%
Core Actual: 0.3%
Previous revision: -0.3% to -0.3%
Regular Forecast: 0.3%
Regular Actual: 0.3%
Previous Revision: -0.2% to -0.6%
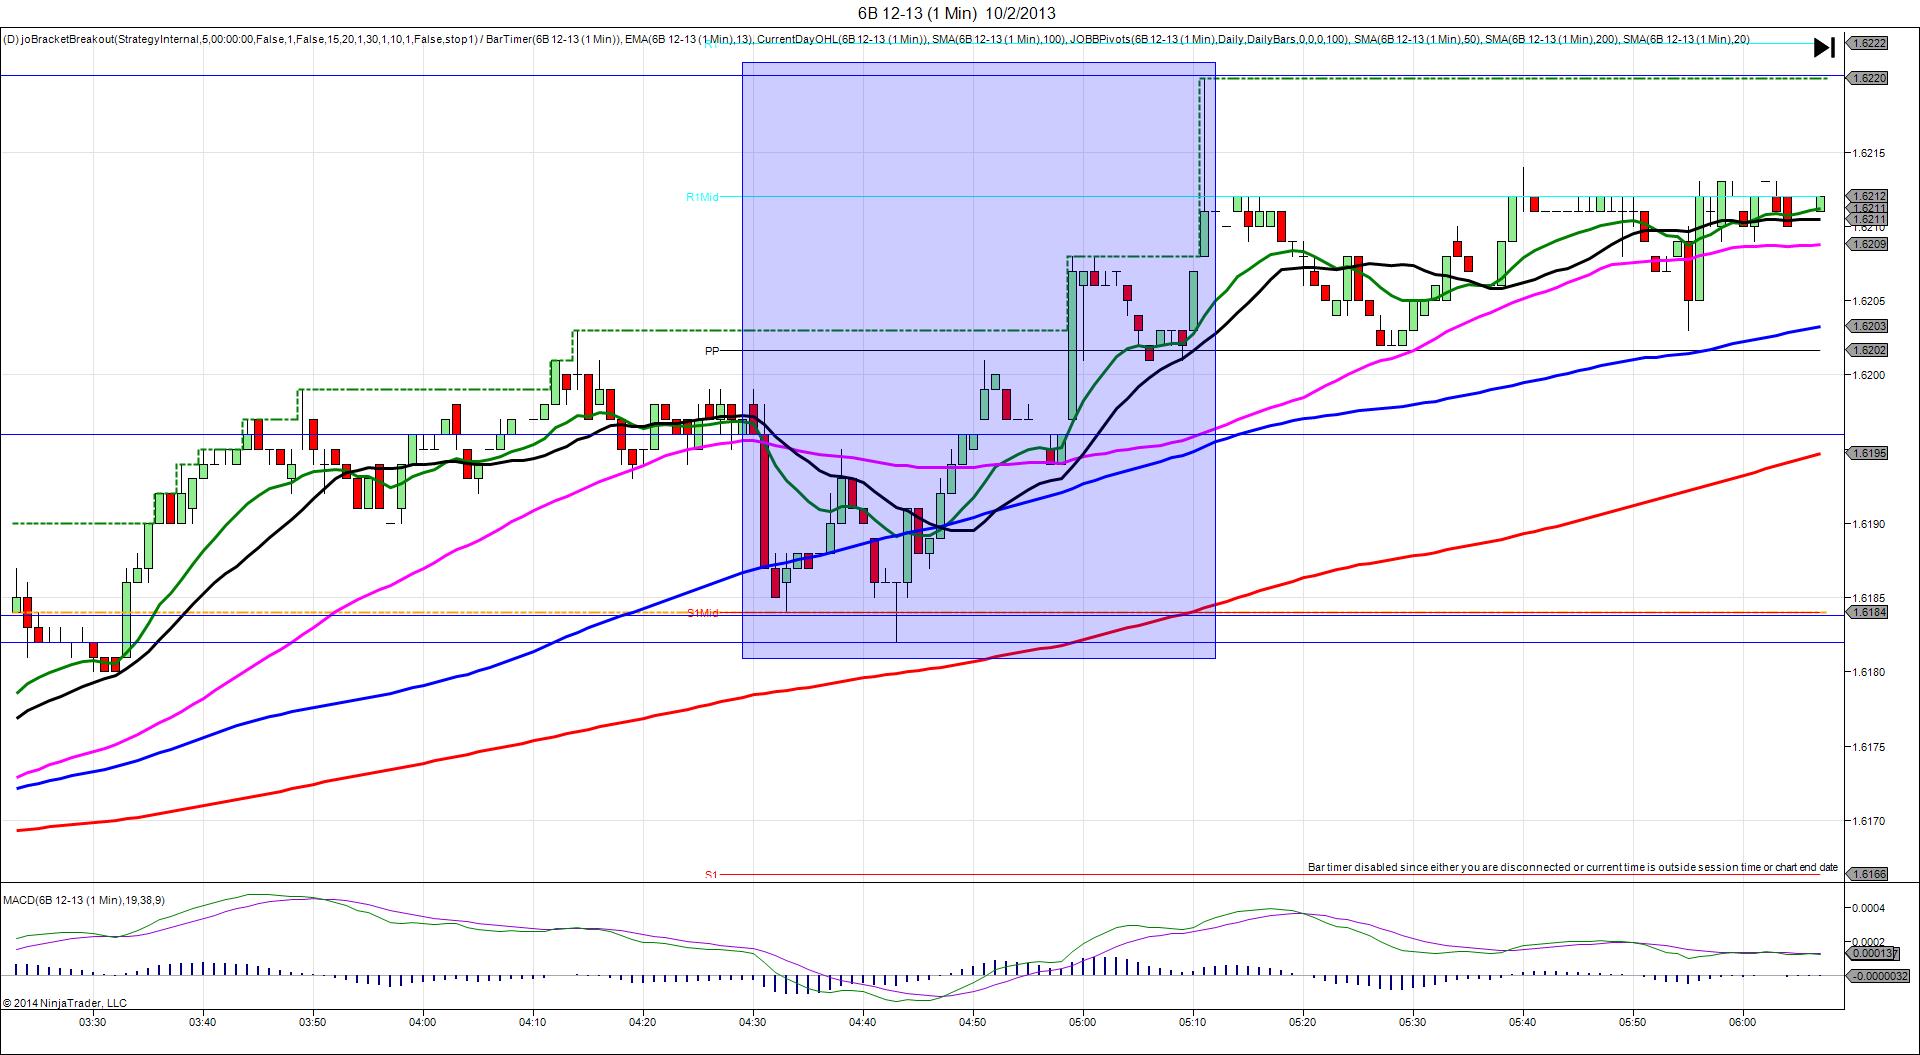
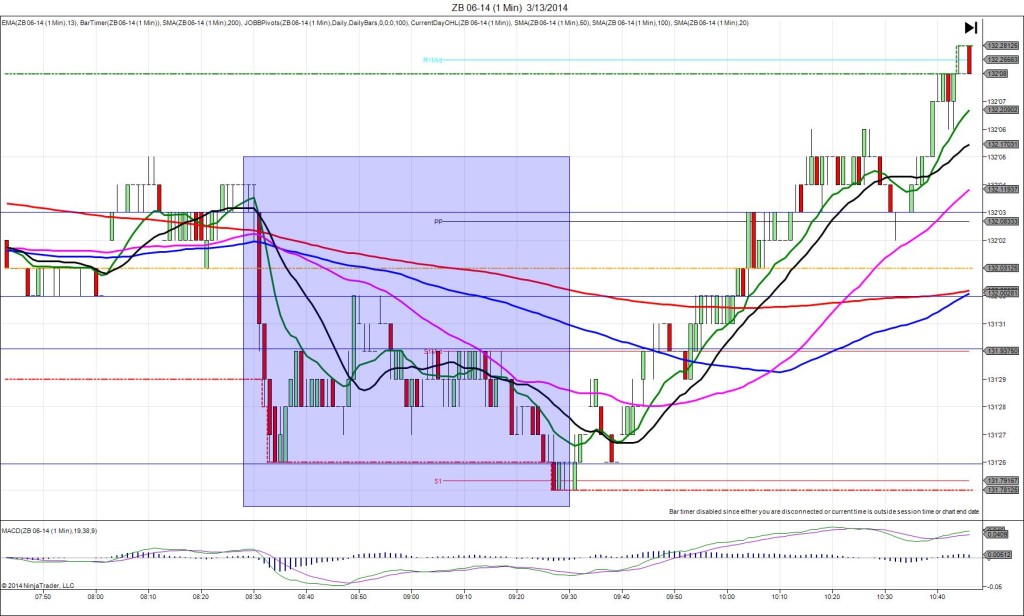
TRAP TRADE (SPIKE WITH 2ND PEAK)
Anchor Point @ 132’03 (last price)
————
Trap Trade:
)))1st Peak @ 131’30 – 0830:15 (1 min)
)))-5 ticks
)))Reversal to 132’01 – 0830:32 (1 min)
)))3 ticks
————
2nd Peak @ 131’26 – 0833 (3 min)
9 ticks
Reversal to 132’00 – 0849 (19 min)
6 ticks
Trap Trade Bracket setup:
Long entries – 131’31 (just above the S1 Mid Pivot) / 131’27 (in between the LOD and S1 Pivot)
Short entries – 132’07 (just below the HOD and R1 Mid Pivot) / 132’11 (no SMA/Pivot near)
Notes: Report was double booked with unemployment claims, so we used the Trap Trade approach. Most of the news was positive with core retail sales and claims while the broader reading matched and we saw downward previous revisions. This caused a short move of 5 ticks in 15 sec that crossed all 3 major SMAs and hit the S1 Mid Pivot. This would have filled the inner long entry with 1 tick to spare, then backed off to hover between the fill point and +2 ticks. Upon noticing the lack of conflict in the news, look to exit with 1 tick of profit. After the :31 bar, it fell for a 2nd peak of 4 more ticks in the next 2 bars to the S1 Pivot, then achieved a reversal of 6 ticks back to the 50 SMA in the next 16 min. After that it trickled lower for a double bottom, then reversed into a long rally after the opening bell for the US session.