12/11/2014 Monthly Retail Sales (0830 EST)
Core Forecast: 0.1%
Core Actual: 0.5%
Previous revision: +0.1% to 0.4%
Regular Forecast: 0.4%
Regular Actual: 0.7%
Previous Revision: +0.2% to 0.5%
Unemployment claims
Forecast: 299K
Actual: 294K
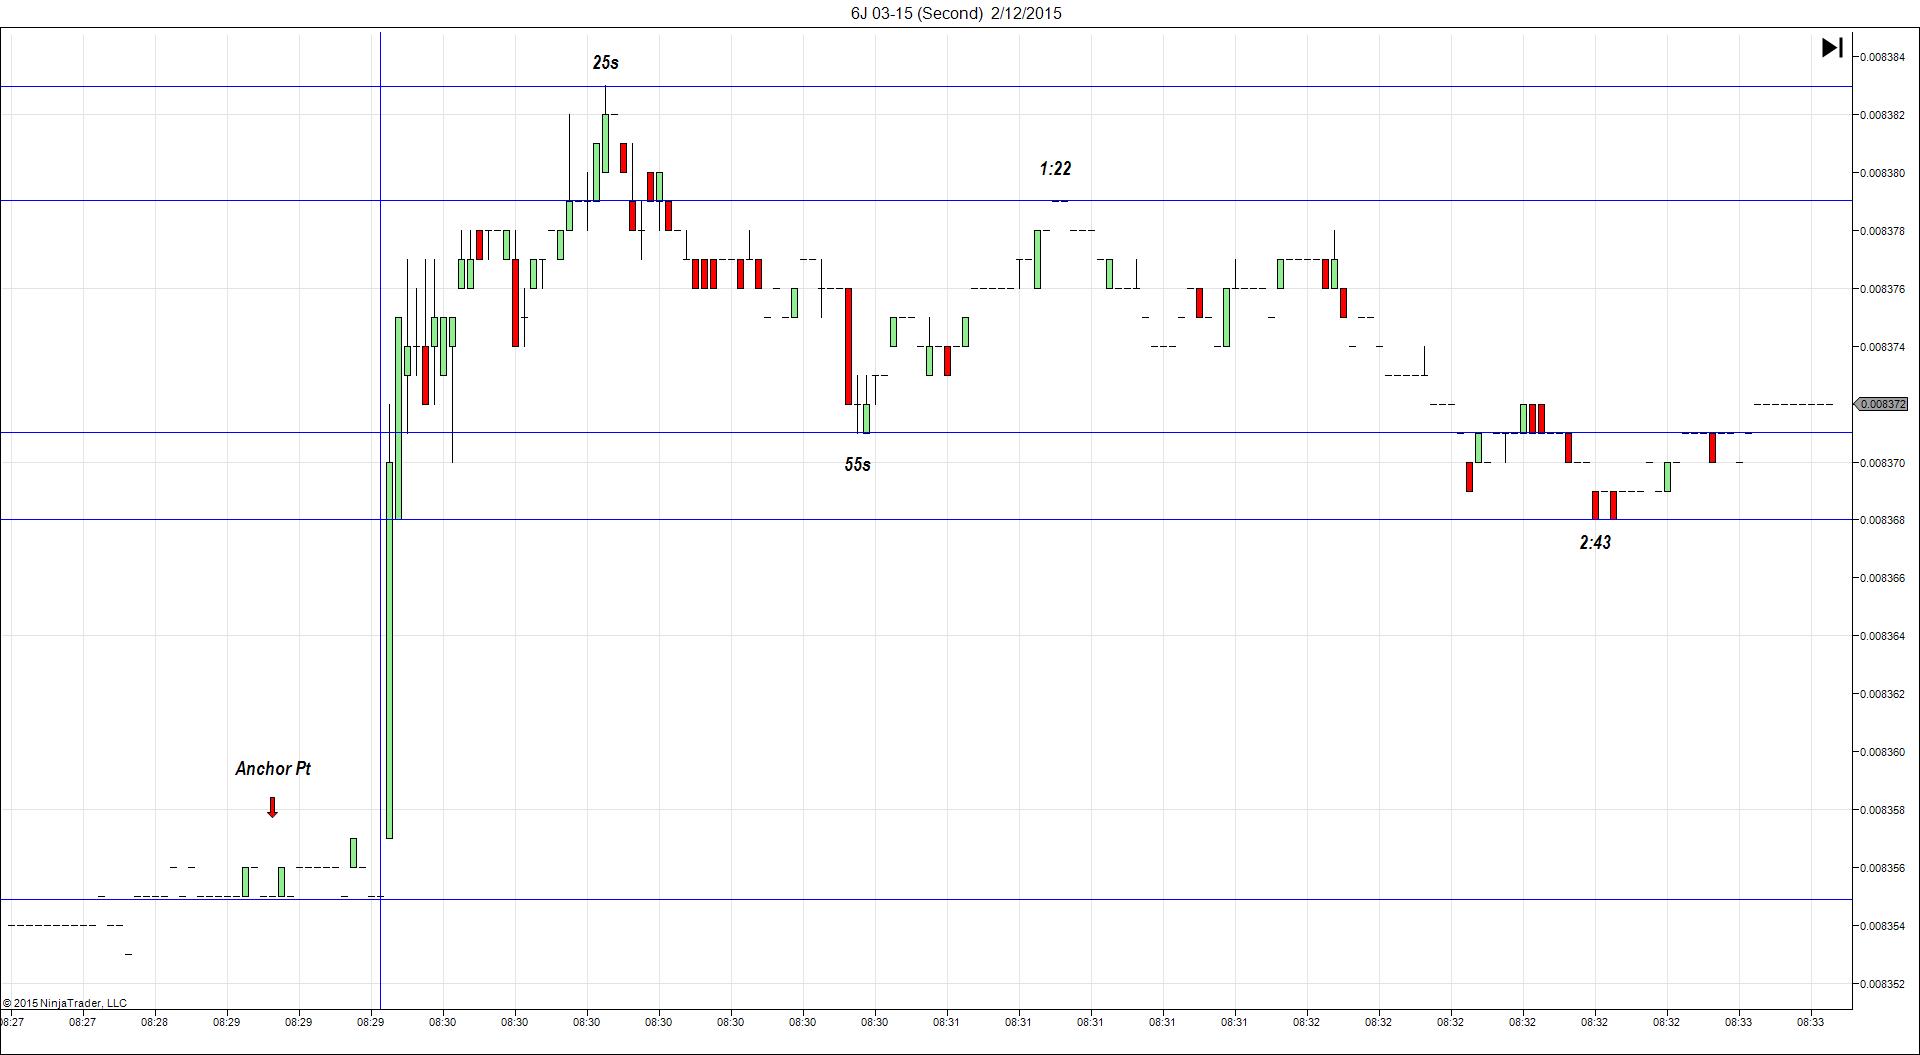
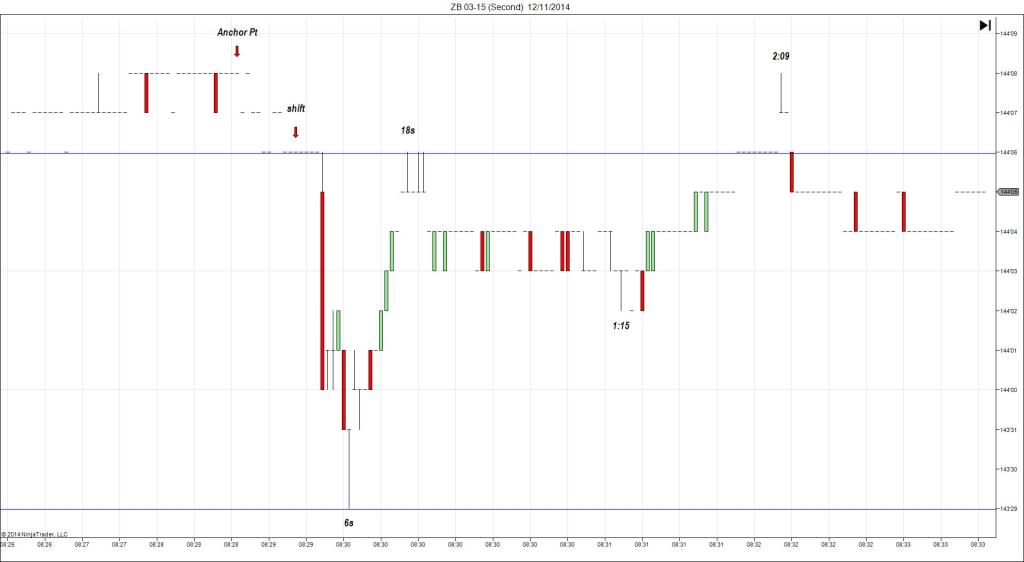
TRAP TRADE – OUTER TIER
Anchor Point @ 144’08 (shift to 144’06)
————
Trap Trade:
)))1st Peak @ 143’29 – 0830:06 (1 min)
)))-9 ticks
)))Reversal to 144’06 – 0830:18 (1 min)
)))9 ticks
)))Pullback to 144’02 – 0831:15 (2 min)
)))-4 ticks
)))Reversal to 144’08 – 0832:09 (3 min)
)))6 ticks
————
Final Peak @ 143’18 – 0937 (67 min)
20 ticks
Reversal to 143’26 – 0958 (88 min)
8 ticks
Trap Trade Bracket setup:
Long entries – 144’01 (no SMA / Pivot near) / 143’30 (on the OOD)
Short entries – 144’11 (just above the 100 SMA) / 144’14 (just above the R2 Mid Pivot)
Notes: Report was double booked with unemployment claims with all results coming in stronger that the forecast. This caused a short move of 9 ticks initially that crossed the OOD / R1 Mid Pivot then retreated. This would have filled both long entries with 1 tick to spare for an average long position at 143’31.5. It reversed for 9 ticks quickly and hovered at 144’05 for 5 sec to allow an exit with 11 total ticks. After a pullback of 4 ticks, it reversed 6 ticks to provide a hovering exit at 144’06 for 13 total ticks. After that it fell for a final peak of 11 more ticks in the next hour after crossing the PP Pivot. Then it reversed 8 ticks in 21 min back to the 50 SMA.