2/25/2015 Weekly Crude Oil Inventory Report (1030 EST)
Forecast: 3.98M
Actual: 8.43M
Gasoline
Forecast: -1.47M
Actual: -3.12M
Distillates
Forecast: -3.05M
Actual: -2.71M
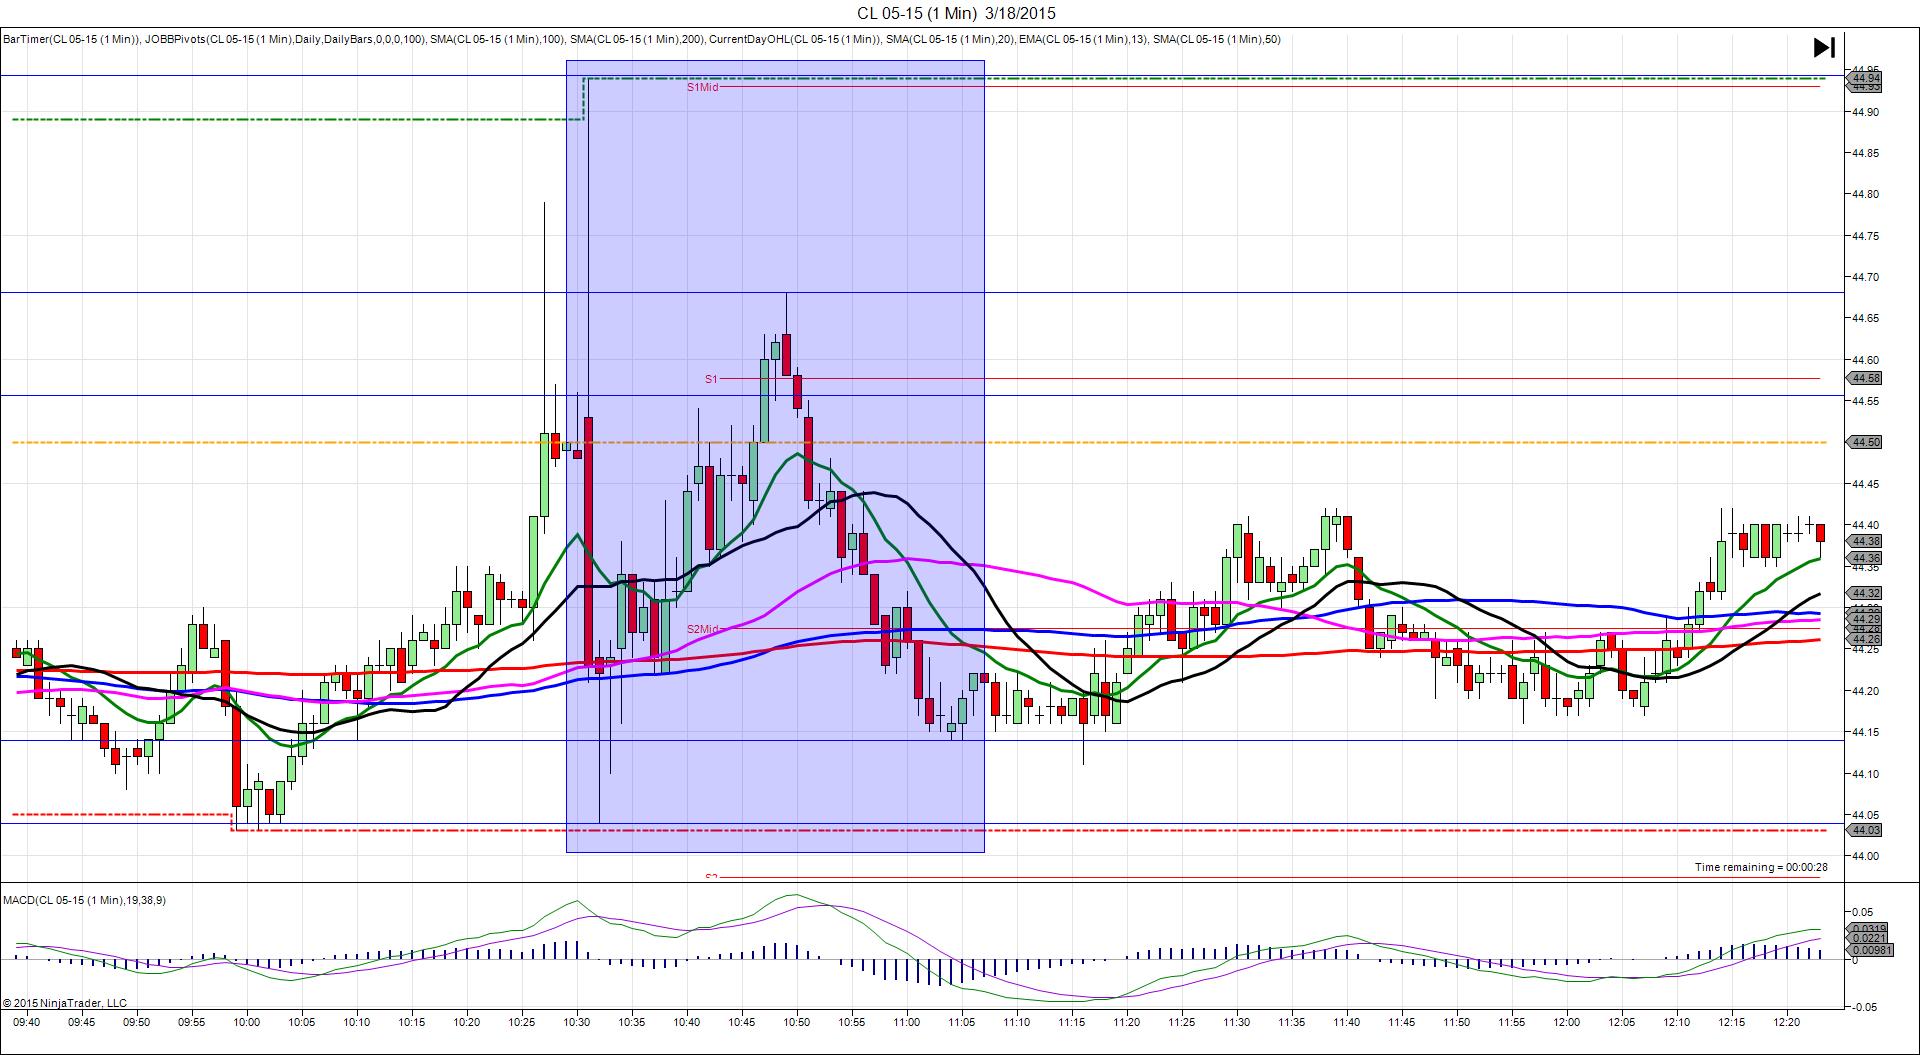
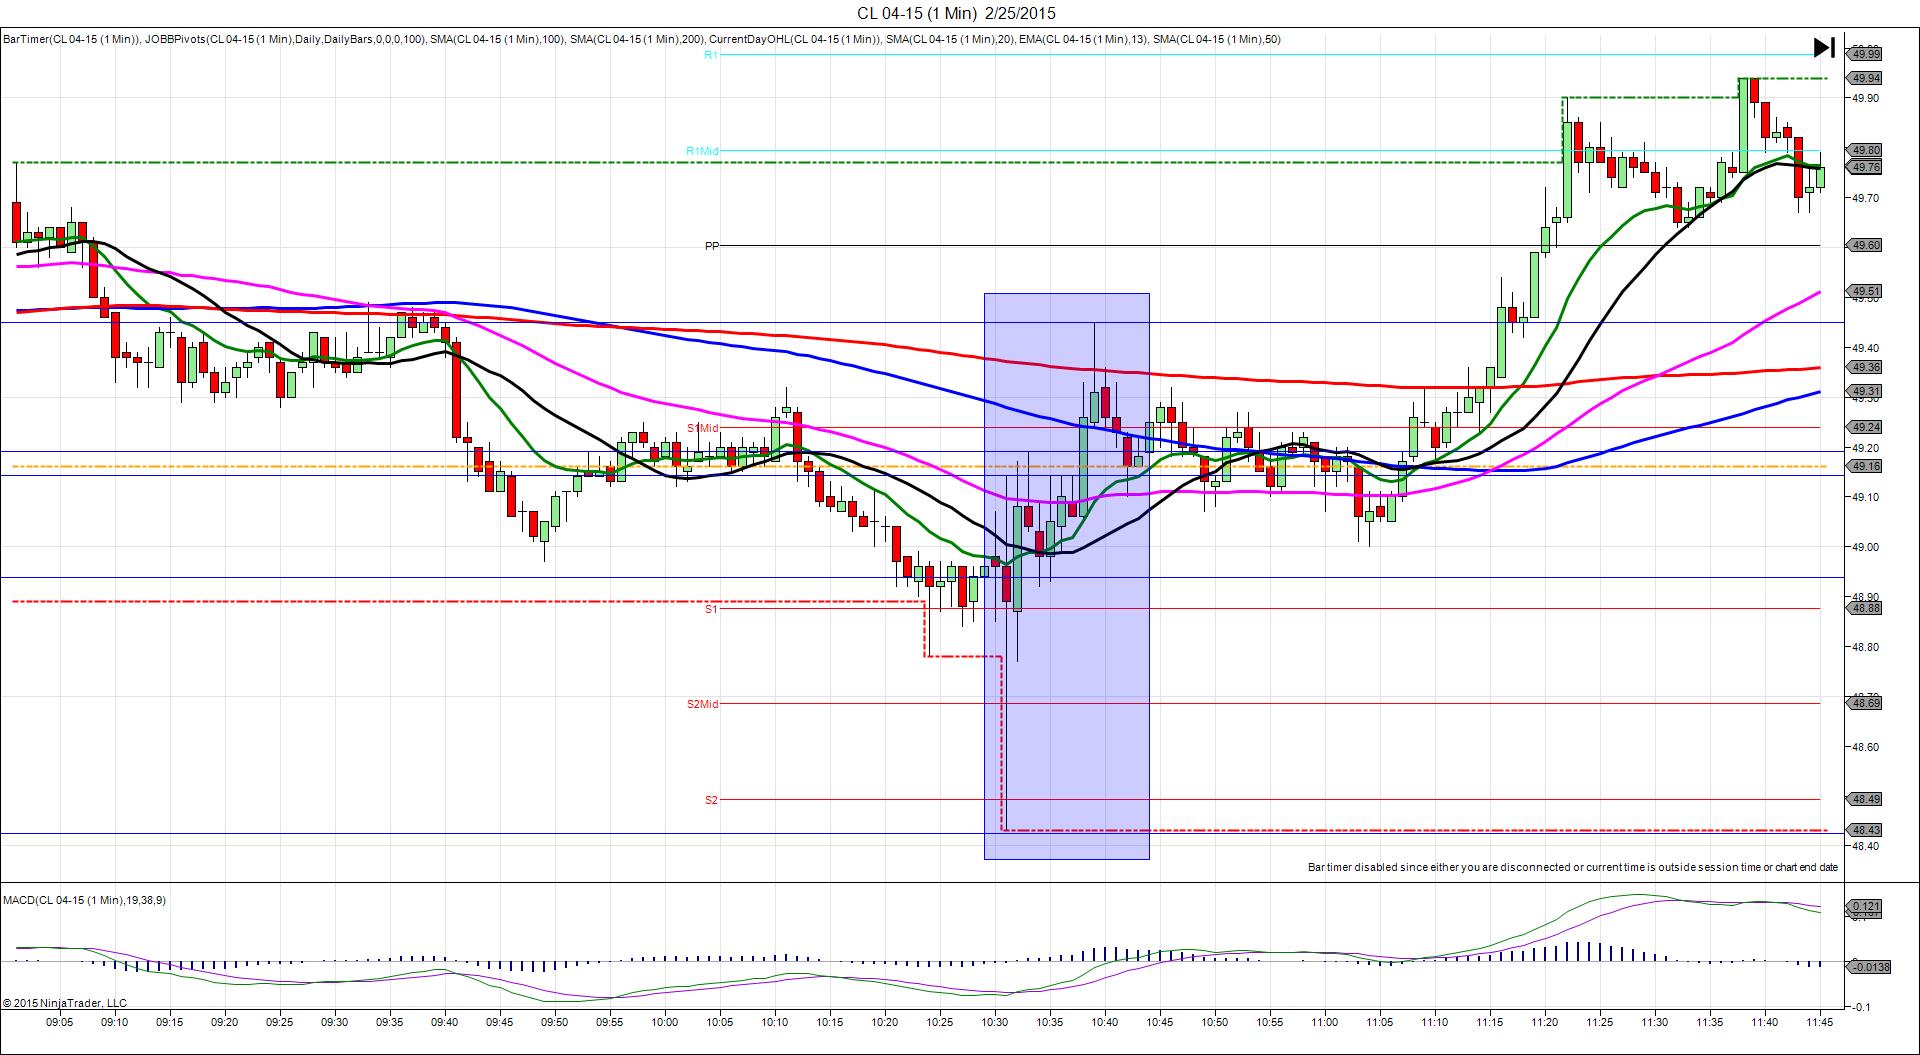
INDECISIVE
Started @ 48.94
1st Peak @ 49.14 – 1030:00 (1 min)
20 ticks
Reversal to 48.43 – 1030:23 (1 min)
71 ticks
Pullback to 49.19 – 1033 (3 min)
76 ticks
Reversal to 48.92 – 1034 (4 min)
27 ticks
2nd Peak @ 49.45 – 1039 (9 min)
51 ticks
Reversal to 49.10 – 1042 (12 min)
35 ticks
Notes: Another large gain in inventories when a healthy gain was expected, while gasoline saw a moderate draw when a modest draw was expected, and distillates saw a near matching moderate draw. This caused a small long spike of 20 ticks that started just below the 13 SMA and climbed to cross the 50 SMA in 1 sec, then promptly reversed for 71 ticks in the next 22 sec. With JOBB and a 10 tick buffer, you would have filled long at about 49.06 with 2 ticks of slippage, then you would have been stopped out 3 sec later at 48.91 for a 15 ticks loss with no slippage. After the reversal, it pulled back 76 ticks in the next 2 min to the OOD. Then it reversed 27 ticks to o cross the 20 SMA in 1 min before climbing for a 2nd peak of 31 more ticks to eclipse the 200 SMA in 5 min. Then it reversed 35 ticks in 3 min to the 50 SMA.