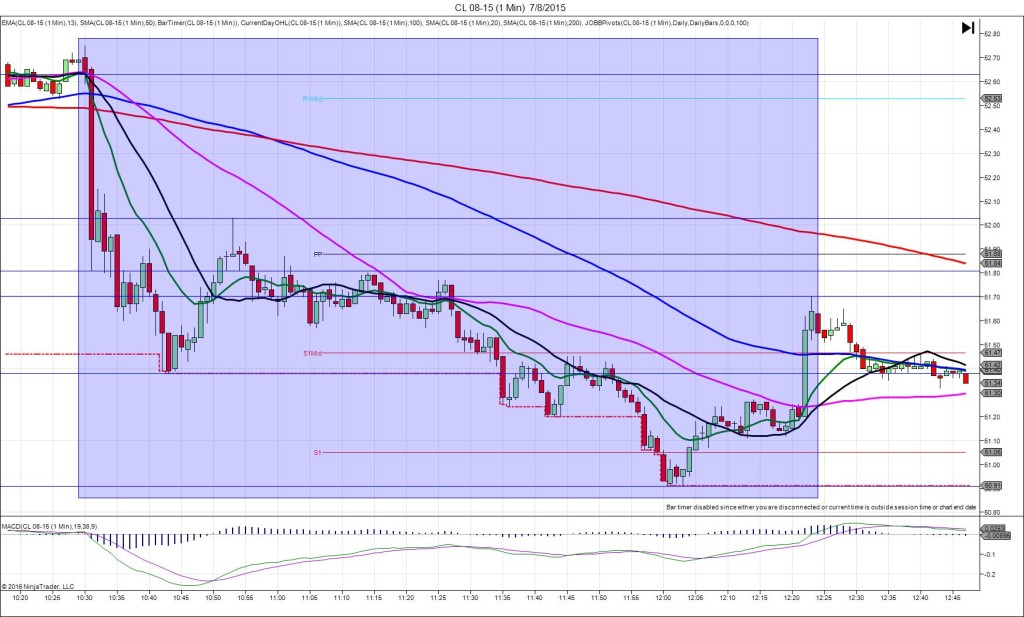
ZC 12-14 (1 Min) 6.30.2014

 Grain Stocks  Comments Off on ZC 12-14 (1 Min) 6.30.2014
Jul 032014
 

ZC 12-14 (1 Min)  6_30_2014ZC 12-14 (Second)  6_30_2014

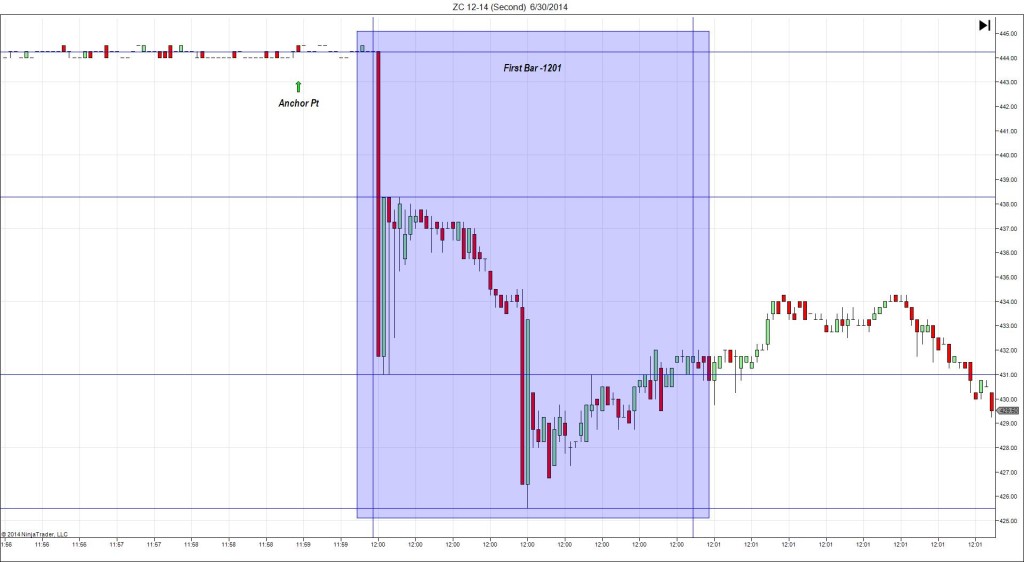
6/30/2014 Grain Stocks – Corn (1200 EDT)
Forecast: n/a
Actual: n/a
TRAP TRADE
Anchor Point @ 444.25 (last price)
————
Trap Trade:
)))1st Peak @ 431.00 – 1200:02 (1 min)
)))-53 ticks

)))Reversal to 438.25 – 1200:05 (1 min)
)))29 ticks

)))2nd Peak @ 425.50 – 1200:29 (1 min)
)))-75 ticks from anchor pt

)))Reversal to 434.25 – 1201:17 (2 min)
)))35 ticks
————
Pullback to 427.25 – 1203 (3 min)
28 ticks

Reversal to 435.00 – 1222 (22 min)
31 ticks

Pullback to 427.00 – 1230 (30 min)
32 ticks

Trap Trade Bracket setup:
Long entries – 431.50 (just above the S3 Pivot) / 428.25 (just below the S3 Mid Pivot)
Short entries – 457.00 (No SMA / Pivot near) / 461.00 (No SMA / Pivot near)

Notes: Report Reaction caused an initial strong bearish reaction that backed off quickly but was more stable than the past two June reports. It fell 53 ticks, crossing all 3 major Pivots and the S3 Pivot after 2 sec, then reversed 29 ticks in the next 3 sec and hovered for about 20 sec. The initial drop would have filled your inner long entry with about 2-3 ticks to spare, then allowed 20-25 ticks to be captured where it hovered near the S2 Mid Pivot. If you did not get out there, your outer long entry would have filled in the second drop that eclipsed the S4 Pivot with about 8-10 ticks to spare. In this case an average entry of about 429.75 would have allowed up to 32 total ticks on 2 contracts to be captured early on the :02 bar or later when it tried to go above the S2 Pivot but failed. Then it fell to nearly reach the S4 Pivot at the bottom of the hour.

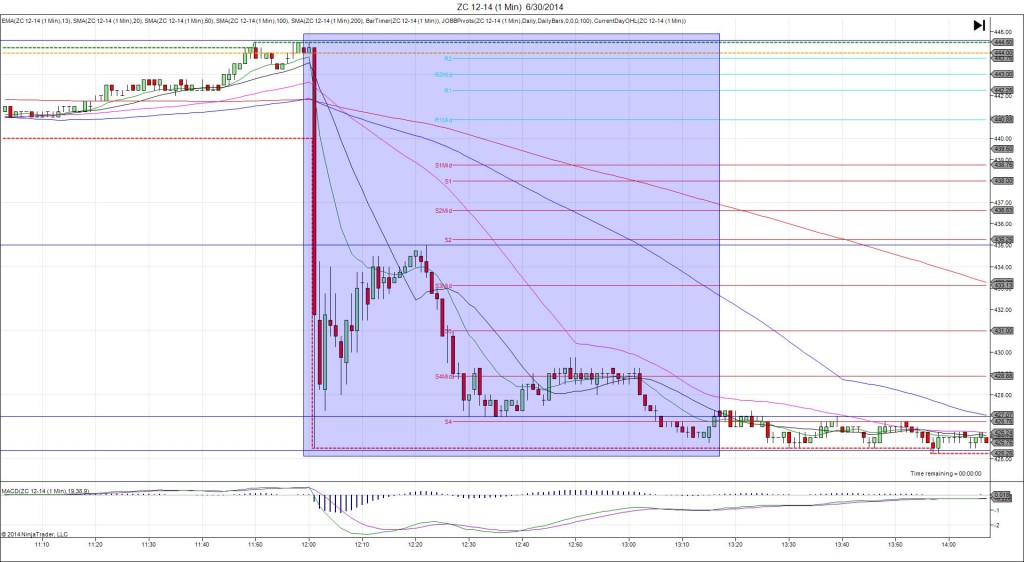
ZB 03-16 (1 Min) 1.6.2016

 FOMC Meeting Minutes  Comments Off on ZB 03-16 (1 Min) 1.6.2016
Jan 132016
 

ZB 03-16 (1 Min) 1_6_2016

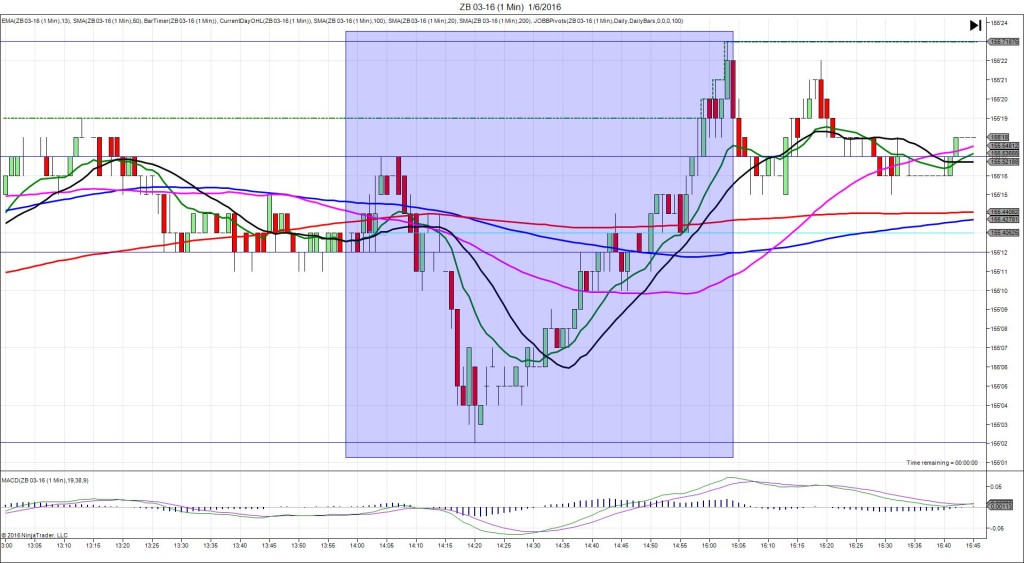
1/6/2016 FOMC Meeting Minutes (1400 EST)
Previous: n/a
Actual: n/a
TRAP TRADE – INNER TIER
Anchor Point @ 155’12
————
Trap Trade:
)))No move – 1401 (1 min)
)))2 ticks
————

Trap Trade Bracket setup:
Long entries – 155’08 (No SMA / Pivot near) / 155’04 (No SMA / Pivot near)
Short entries – 155’16 (just above the 100 / 50 SMAs) / 155’20 (just above the HOD)

Expected Fill: n/a – cancel
Best Initial Exit: n/a
Recommended Profit Target placement: n/a

Notes: Surprising dull move after the first rate hike in several years.

6J 03-16 (1 Min) 1.6.2016

 ISM Non-Manufacturing PMI  Comments Off on 6J 03-16 (1 Min) 1.6.2016
Jan 132016
 

6J 03-16 (1 Min) 1_6_2016

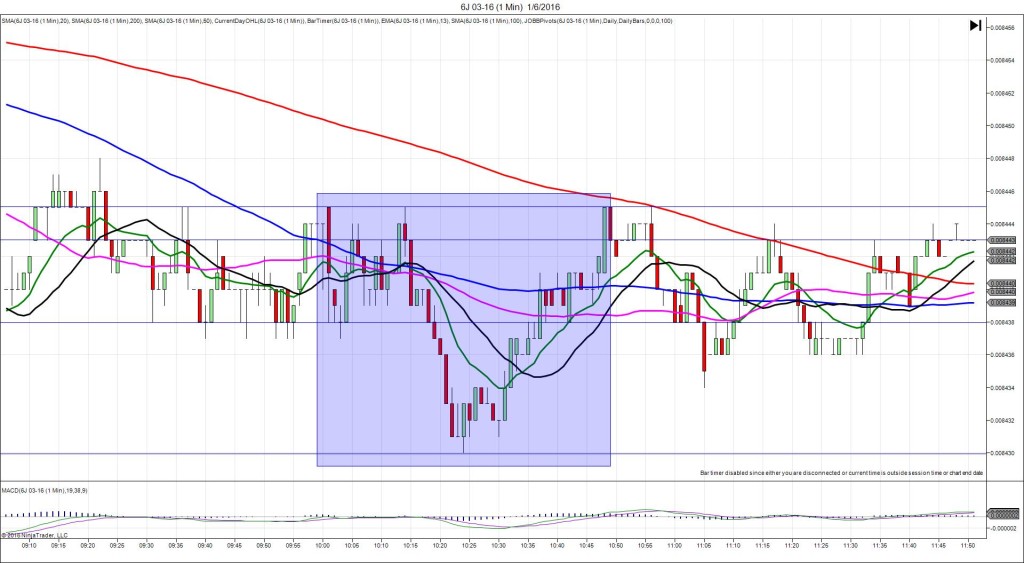
1/6/2016 Monthly ISM Non-Manufacturing PMI (1000 EST)
Forecast: 56.0
Actual: 55.3
Previous Revision: n/a
DULL FILL
Started @ 0.008443
1st Peak @ 0.0084338 – 1000:45 (1 min)
5 ticks

Reversal to 0.008445 – 1014 (14 min)
7 ticks

2nd Peak @ 0.008430 – 1024 (24 min)
13 ticks

Reversal to 0.008445 – 1048 (48 min)
15 ticks

Expected Fill: 0.008440 (short)
Slippage: 0 ticks
Best Initial Exit: 0.008439 – 1 tick
Recommended Profit Target placement: 0.008435 (Near the Low from 0900)

Notes: Small offset caused a dull fill worthy of an exit near breakeven.

ZB 03-16 (1 Min) 1.14.2016

 30y Bond Auction  Comments Off on ZB 03-16 (1 Min) 1.14.2016
Jan 152016
 

ZB 03-16 (1 Min) 1_14_2016

Caption for 1/14:
1/14/2016 30-yr Bond Auction (1301 EDT)
Previous: 2.98/2.4
Actual: 2.91/2.3
SPIKE WITH 2ND PEAK
Started @ 157’14 (1301:30)
1st Peak @ 157’02 – 1303:40 (3 min)
12 ticks

Reversal to 157’11 – 1318 (17 min)
9 ticks

2nd Peak @ 156’30 – 1332 (32 min)
16 ticks

Reversal to 157’07 – 1346 (45 min)
9 ticks

Expected Fill: 157’10 (short)
Slippage: 1 tick
Best Initial Exit: 157’03 – 7 ticks
Recommended Profit Target placement: 157’05 or 04 (just below the S1 Pivot)

Notes: Nice short spike used the 50 SMA as a springboard to go short and again for the 2nd peak. Nice 2nd peak opportunity to short it between the 20 and 50 SMAs at 157’10 or 09.

ZB 03-16 (1 Min) 1.13.2016

 10y Bond Auction  Comments Off on ZB 03-16 (1 Min) 1.13.2016
Jan 152016
 

ZB 03-16 (1 Min) 1_13_2016

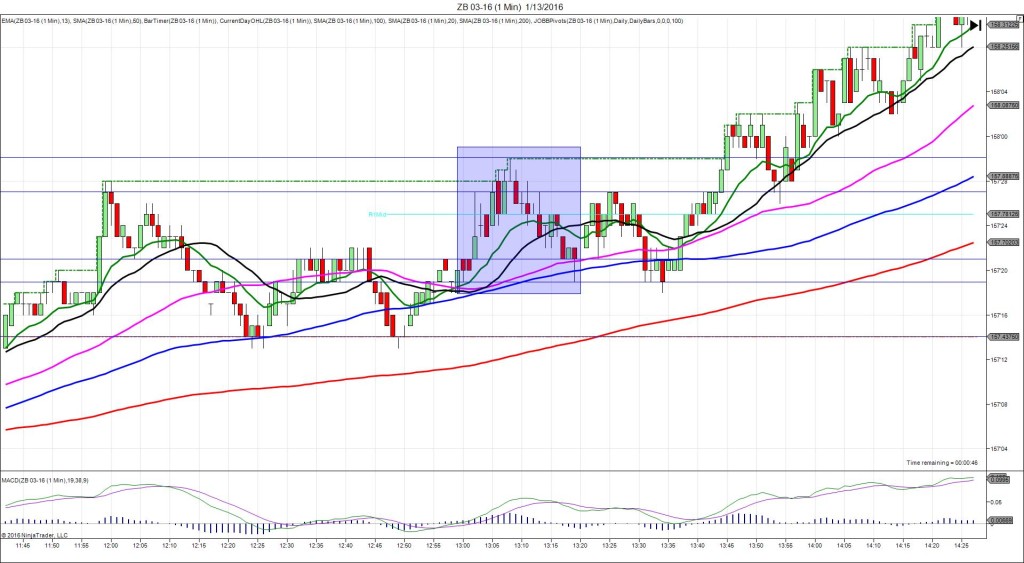
1/13/2015 10-yr Bond Auction (1301 EST)
Previous: 2.23/2.6
Actual: 2.09/2.8
SPIKE WITH 2ND PEAK
Started @ 157’21 (1301)
1st Peak @ 157’27 – 1301:39 (1 min)
6 ticks

Reversal to 157’23 – 1304 (3 min)
4 ticks

2nd Peak @ 157’30 – 1308 (7 min)
9 ticks

Reversal to 157’19 – 1319 (18 min)
11 ticks

Expected Fill: 157’23 (short)
Slippage: 0 ticks
Best Initial Exit: 157’26 – 3 ticks
Recommended Profit Target placement: 157’28 (on the HOD)

Notes: Spike was quick and fell just short of the HOD. This would have allowed up to 3 ticks immediately with a profit target, or up to 6 ticks after 6 min as the reversal would not have gone below the fill point.

ZC 05-14 (1 Min) 3.31.2014

 Grain Stocks  Comments Off on ZC 05-14 (1 Min) 3.31.2014
Apr 172014
 

ZC 05-14 (1 Min)  3_31_2014

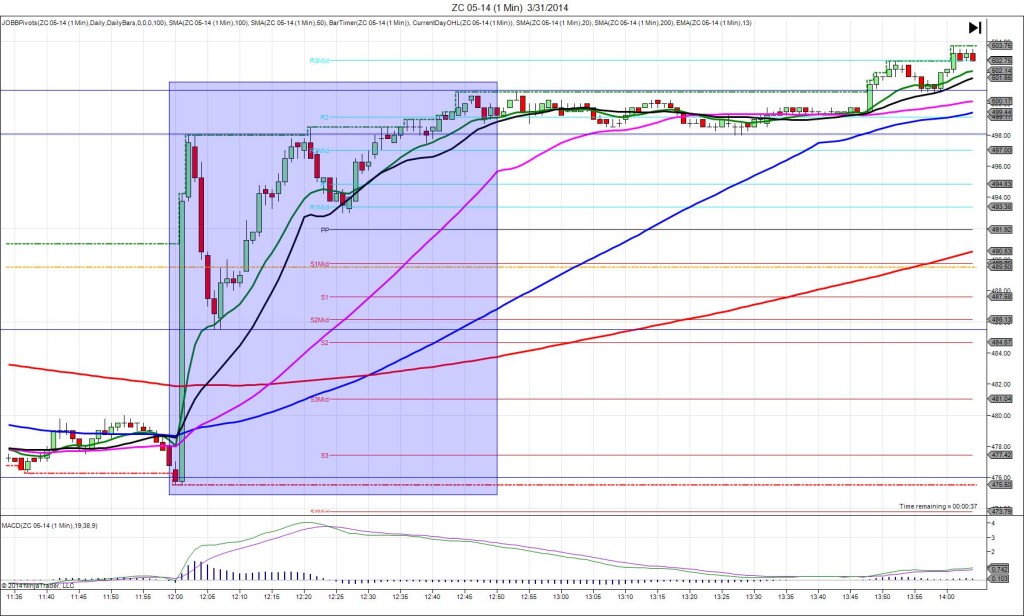
3/31/2014 Grain Stocks – Corn (1200 EST)
Forecast: n/a
Actual: n/a
SPIKE WITH 2ND PEAK
Started @ 476.00
1st Peak @ 498.00 – 1202 (2 min)
88 ticks

Reversal to 485.50 – 1206 (6 min)
50 ticks

2nd Peak @ 500.75 – 1244 (44 min)
99 ticks

Reversal to 498.75 – 1248 (48 min)
8 ticks

Notes: Report Reaction caused a strong bullish reaction. It climbed 88 ticks, crossing all 3 major Pivots and the R2 Mid Pivot over 2 bars in a large sustained reaction. With JOBB, you would have filled long with about 6-8 ticks of slippage, then seen it shoot for the moon. This is one of those reports that you can patiently wait for it to continue to heap on more ticks into the 2nd bar. An exit above 495 would have been ideal for at least 64 ticks. After the 1st peak, it fell for 50 ticks in the next 4 min leaving a great buy opportunity as it hit the 13 SMA for the beginning of the 2nd peak. It climbed to a double top in about 12 min and another 11 ticks 30 min later. Buying the dips would be very safe in this situation. After the 2nd peak, it backed off only 8 ticks and traded sideways in a narrow range around the R2 Pivot. Then at the end of the session, it climbed a bit more to close the session.

6J 12-15 (1 Min) 10.20.2015

 Building Permits / Housing Starts  Comments Off on 6J 12-15 (1 Min) 10.20.2015
Jan 162016
 

6J 12-15 (1 Min) 10_20_2015

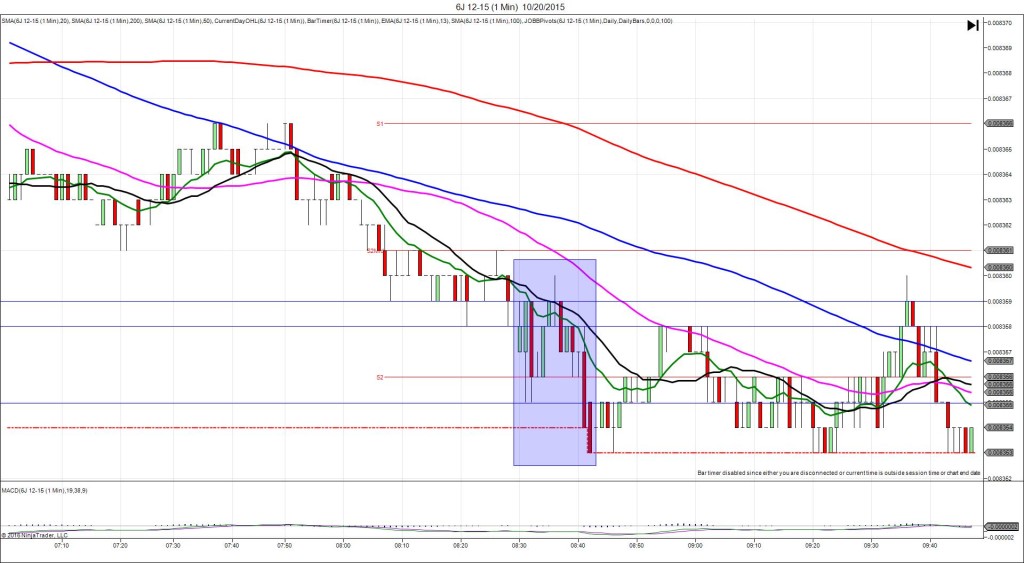
10/20/2015 Monthly Building Permits / Housing Starts (0830 EDT)
Building Permits
Forecast: 1.16M
Actual: 1.10M
Previous revision: -0.01M to 1.16M
Housing Starts
Forecast: 1.14M
Actual: 1.21M
Previous revision: n/a
DULL FILL
Started @ 0.008358
1st Peak @ 0.008355 – 0830:11 (1 min)
3 ticks

Reversal to 0.008359 – 0830:56 (1 min)
4 ticks

Expected Fill: 0.008355 (short)
Slippage: 0 ticks
Best Initial Exit: 0.008356 – 1 tick loss
Recommended Profit Target placement: 0.008350 (5 ticks)

Notes: Another dull move. If you were fortunate, you would have cancelled the order after 10 sec with no fill, otherwise look to exit near breakeven with a 1 tick loss.

6J 12-15 (1 Min) 11.18.2015

 Building Permits / Housing Starts  Comments Off on 6J 12-15 (1 Min) 11.18.2015
Jan 162016
 

6J 12-15 (1 Min) 11_18_2015

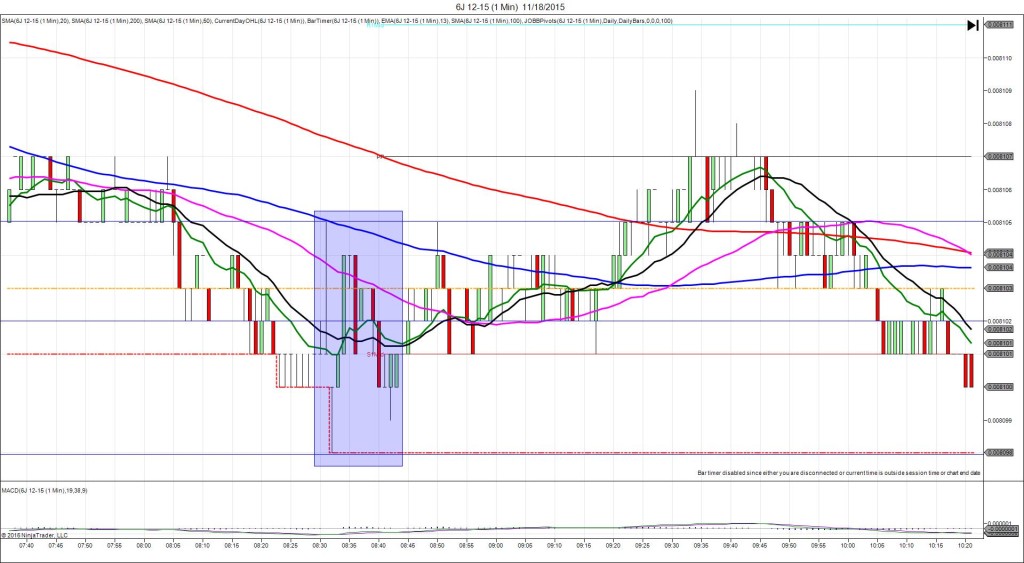
11/18/2015 Monthly Building Permits / Housing Starts (0830 EST)
Building Permits
Forecast: 1.15M
Actual: 1.15M
Previous revision: +0.01M to 1.11M
Housing Starts
Forecast: 1.16M
Actual: 1.06M
Previous revision: -0.02M to 1.19M
DULL FILL
Started @ 0.008102
1st Peak @ 0.008105 – 0830:01 (1 min)
3 ticks

Reversal to 0.008098 – 0831:28 (2 min)
7 ticks

Expected Fill: 0.008105 (long)
Slippage: 0 ticks
Best Initial Exit: 0.008104 – 1 tick loss
Recommended Profit Target placement: 0.008108 (just above the PP Pivot / 200 SMA)

Notes: Another dull move. Look to exit in the first 26 sec as it hovered between 1-2 ticks in the red.

CL 08-15 (1 Min) 7.1.2015

 Oil Inventory  Comments Off on CL 08-15 (1 Min) 7.1.2015
Jan 172016
 

CL 08-15 (1 Min) 7_1_2015

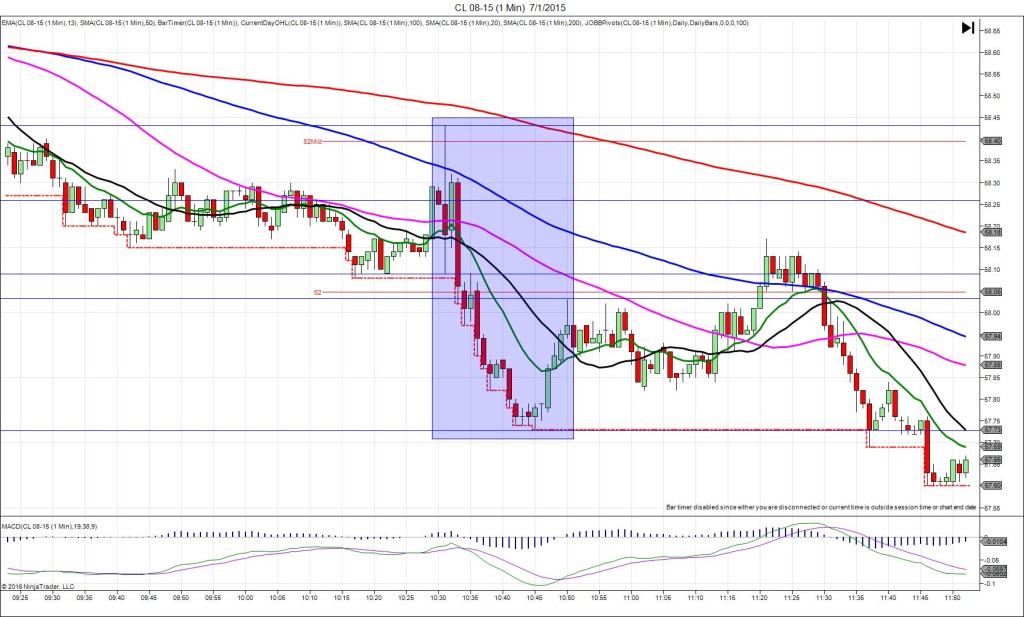
7/1/2015 Weekly Crude Oil Inventory Report (1030 EDT)
Forecast: -2.00M
Actual: 2.39M
Gasoline
Forecast: 0.46M
Actual: -1.76M
Distillates
Forecast: 1.62M
Actual: 0.39M
DULL FILL…SPIKE WITH 2ND PEAK
Started @ 58.26
1st Peak @ 58.11 – 1030:00 (1 min)
15 ticks

Reversal to 58.43 – 1030:08 (1 min)
32 ticks

Pullback to 58.09 – 1030:36 (1 min)
34 ticks

Reversal to 58.32 – 1032 (2 min)
23 ticks

2nd Peak @ 57.73 – 1045 (15 min)
53 ticks

Reversal to 58.03 – 1050 (20 min)
30 ticks

Expected Fill: 58.16 (short)
Slippage: 0 ticks
Best Initial Exit: 58.14 – 2 ticks
Recommended Profit Target placement: 57.96 (20 ticks)

Notes: Small spike, hovering and then a sharp reversal after 5 sec. This is why we recommend exiting if hovering is seen and tightening the stop loss. Also notice it hovered after the reversal between the 100 SMA and S2 Mid Pivot and pulled back nicely. Nice 2nd peak.

CL 08-15 (1 Min) 7.8.2015

 Oil Inventory  Comments Off on CL 08-15 (1 Min) 7.8.2015
Jan 172016
 

CL 08-15 (1 Min) 7_8_2015

7/8/2015 Weekly Crude Oil Inventory Report (1030 EDT)
Forecast: -0.70M
Actual: 0.38M
Gasoline
Forecast: -0.25M
Actual: 1.22M
Distillates
Forecast: 0.86M
Actual: 1.64M
SPIKE WITH 2ND PEAK
Started @ 52.63
1st Peak @ 51.81 – 1030:53 (1 min)
82 ticks

Reversal to 52.15 – 1031:29 (2 min)
34 ticks

2nd Peak @ 51.38 – 1043 (13 min)
125 ticks

Reversal to 52.03 – 1053 (23 min)
65 ticks

Final Peak @ 50.91 – 1201 (91 min)
172 ticks

Reversal to 51.70 – 1223 (113 min)
79 ticks

Expected Fill: 52.48 (short)
Slippage: 5 ticks
Best Initial Exit: 51.82 – 66 ticks
Recommended Profit Target placement: 52.23 (25 ticks) – move lower as it continued trickling down

Notes: Large reaction as all the products saw gains. It found support at the PP Pivot then the S1 Mid and S1 Pivots on later peaks.