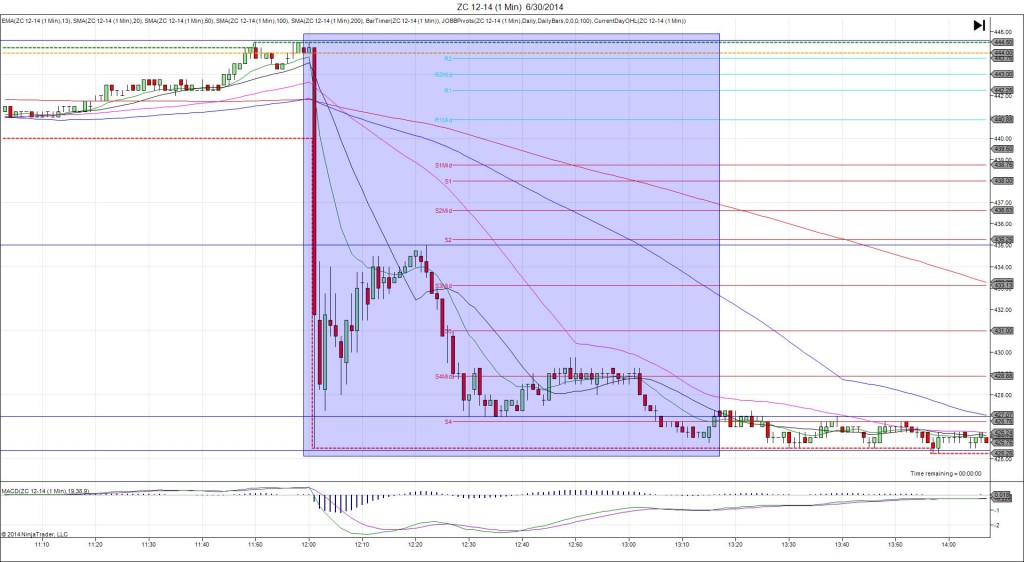
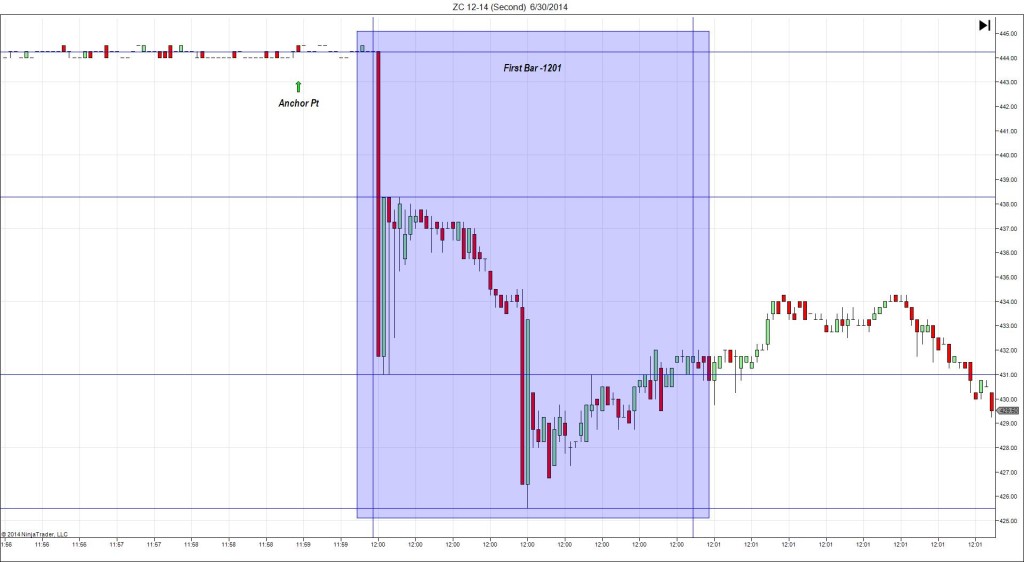
6/30/2014 Grain Stocks – Corn (1200 EDT)
Forecast: n/a
Actual: n/a
TRAP TRADE
Anchor Point @ 444.25 (last price)
————
Trap Trade:
)))1st Peak @ 431.00 – 1200:02 (1 min)
)))-53 ticks
)))Reversal to 438.25 – 1200:05 (1 min)
)))29 ticks
)))2nd Peak @ 425.50 – 1200:29 (1 min)
)))-75 ticks from anchor pt
)))Reversal to 434.25 – 1201:17 (2 min)
)))35 ticks
————
Pullback to 427.25 – 1203 (3 min)
28 ticks
Reversal to 435.00 – 1222 (22 min)
31 ticks
Pullback to 427.00 – 1230 (30 min)
32 ticks
Trap Trade Bracket setup:
Long entries – 431.50 (just above the S3 Pivot) / 428.25 (just below the S3 Mid Pivot)
Short entries – 457.00 (No SMA / Pivot near) / 461.00 (No SMA / Pivot near)
Notes: Report Reaction caused an initial strong bearish reaction that backed off quickly but was more stable than the past two June reports. It fell 53 ticks, crossing all 3 major Pivots and the S3 Pivot after 2 sec, then reversed 29 ticks in the next 3 sec and hovered for about 20 sec. The initial drop would have filled your inner long entry with about 2-3 ticks to spare, then allowed 20-25 ticks to be captured where it hovered near the S2 Mid Pivot. If you did not get out there, your outer long entry would have filled in the second drop that eclipsed the S4 Pivot with about 8-10 ticks to spare. In this case an average entry of about 429.75 would have allowed up to 32 total ticks on 2 contracts to be captured early on the :02 bar or later when it tried to go above the S2 Pivot but failed. Then it fell to nearly reach the S4 Pivot at the bottom of the hour.

