2/5/2014 Monthly Retail Sales / Trade Balance (1930 EST)
Rtl Sales
Forecast: 0.5%
Actual: 0.5%
Previous Revision: n/a
Trade Bal
Forecast: -0.27B
Actual: 0.47B
Previous Revision: +0.20B to 0.08B
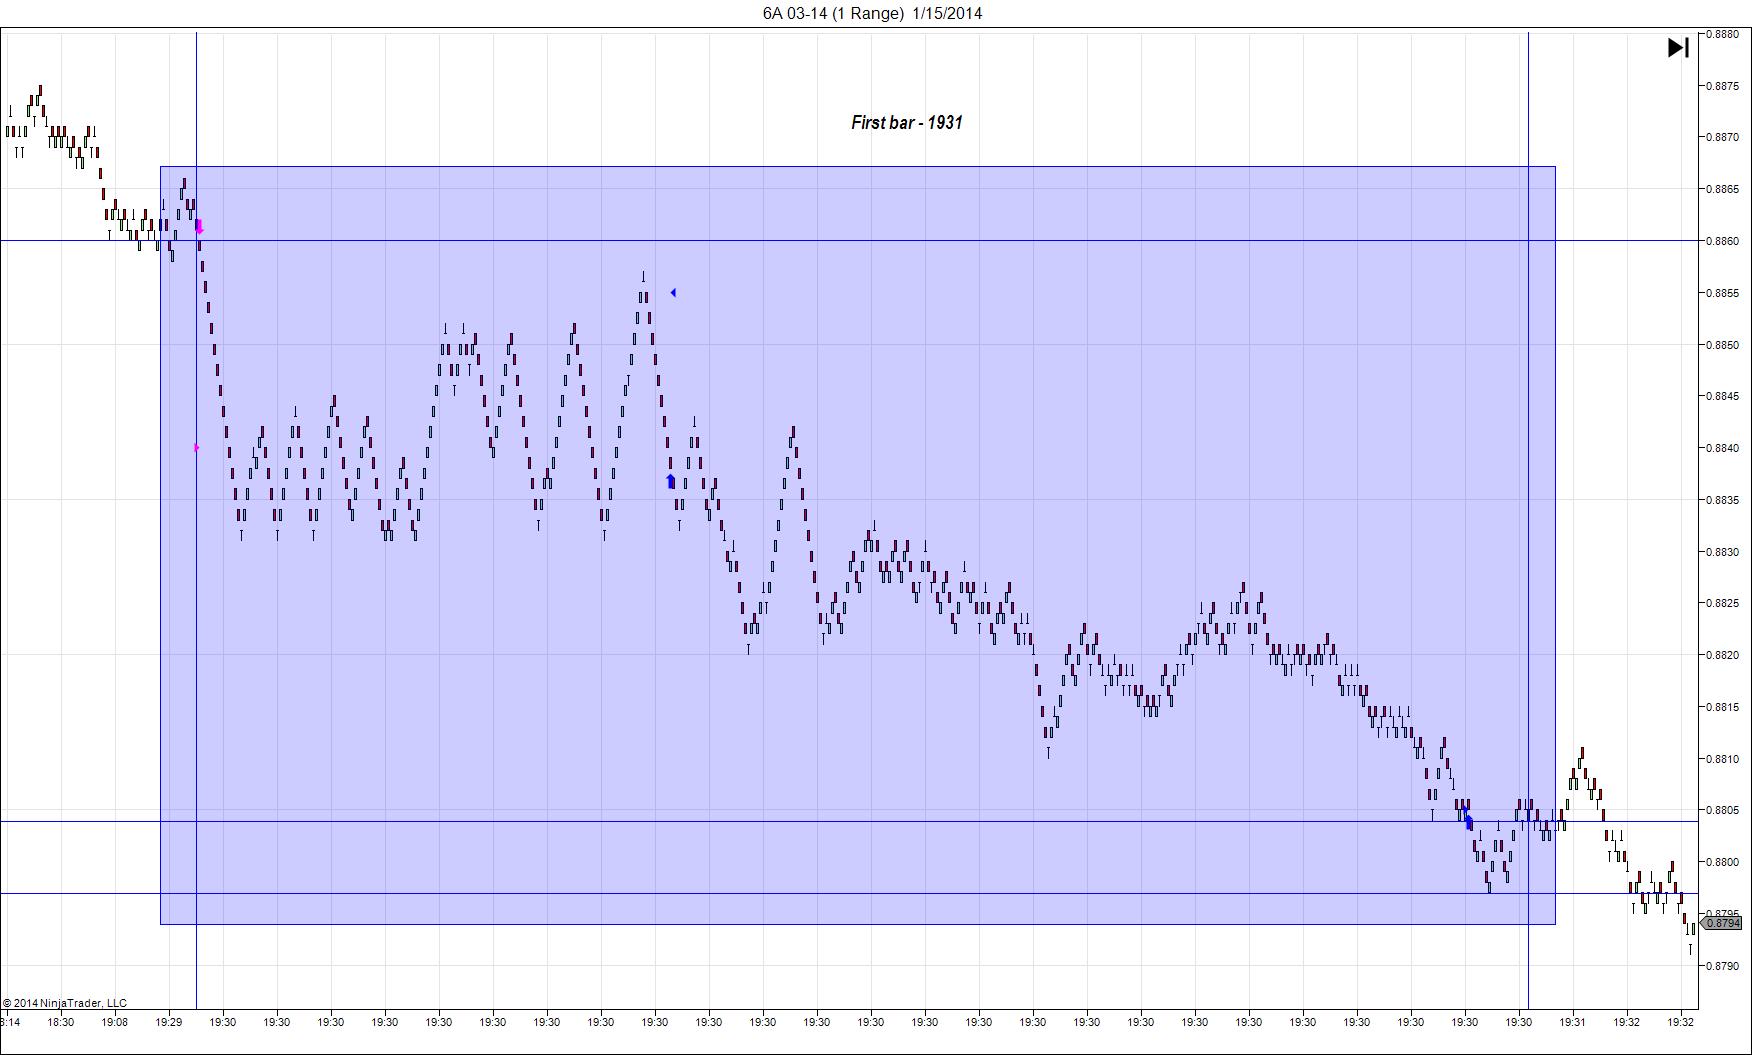
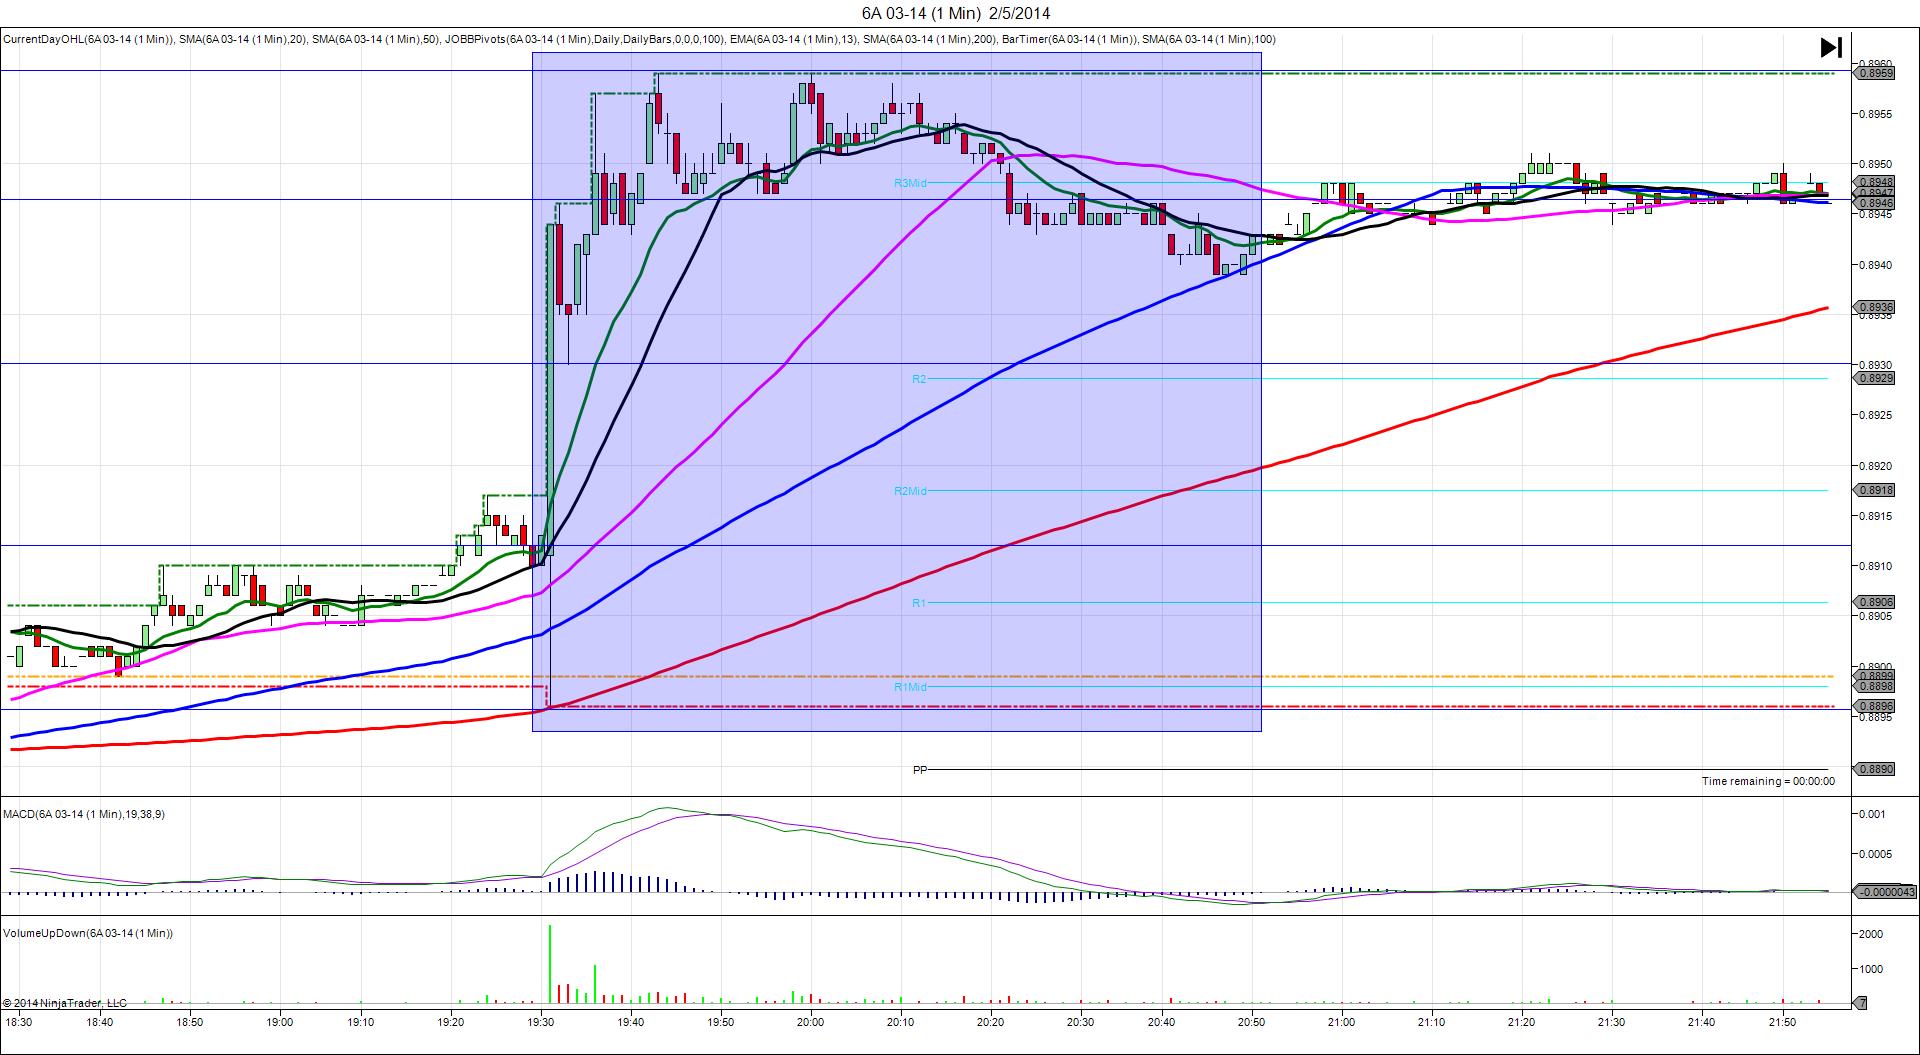
TRAP TRADE
Anchor Point @ 0.8912 (last price)
————
Trap Trade:
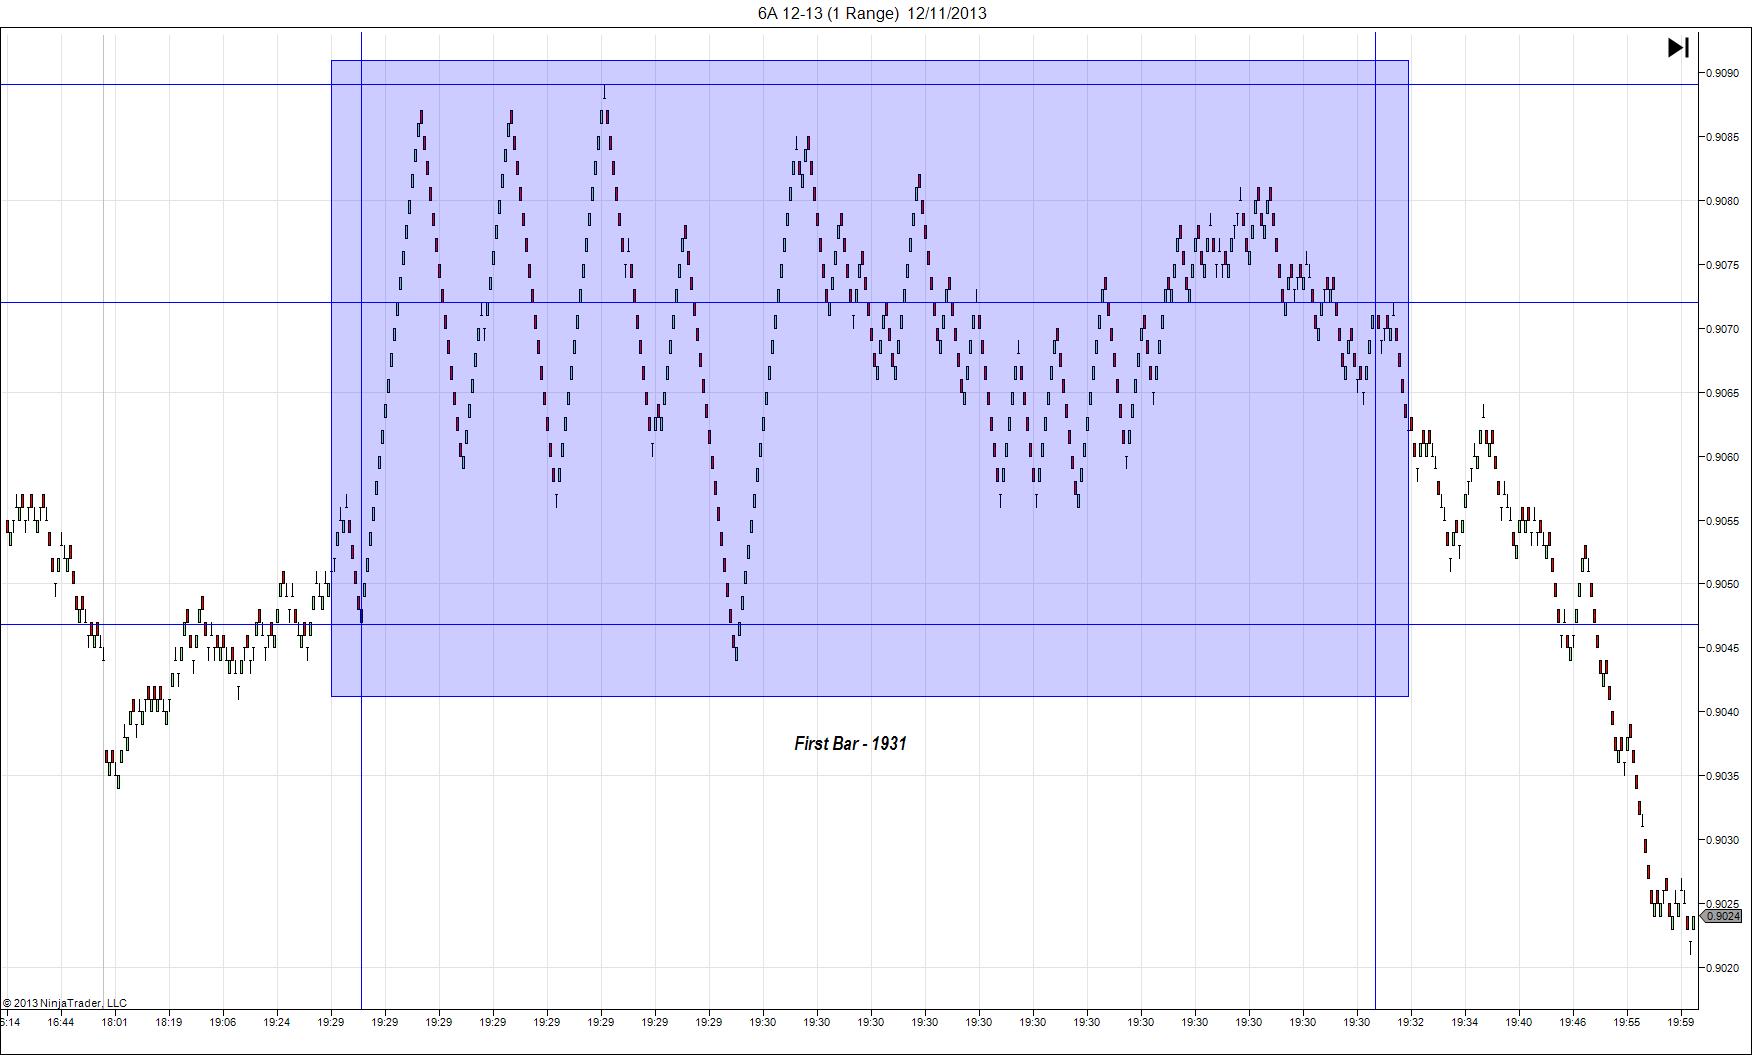
)))1st Peak @ 0.8896 – 1930:04 (1 min)
)))-16 ticks
)))Reversal to 0.8946 – 1931:04 (2 min)
)))50 ticks
————
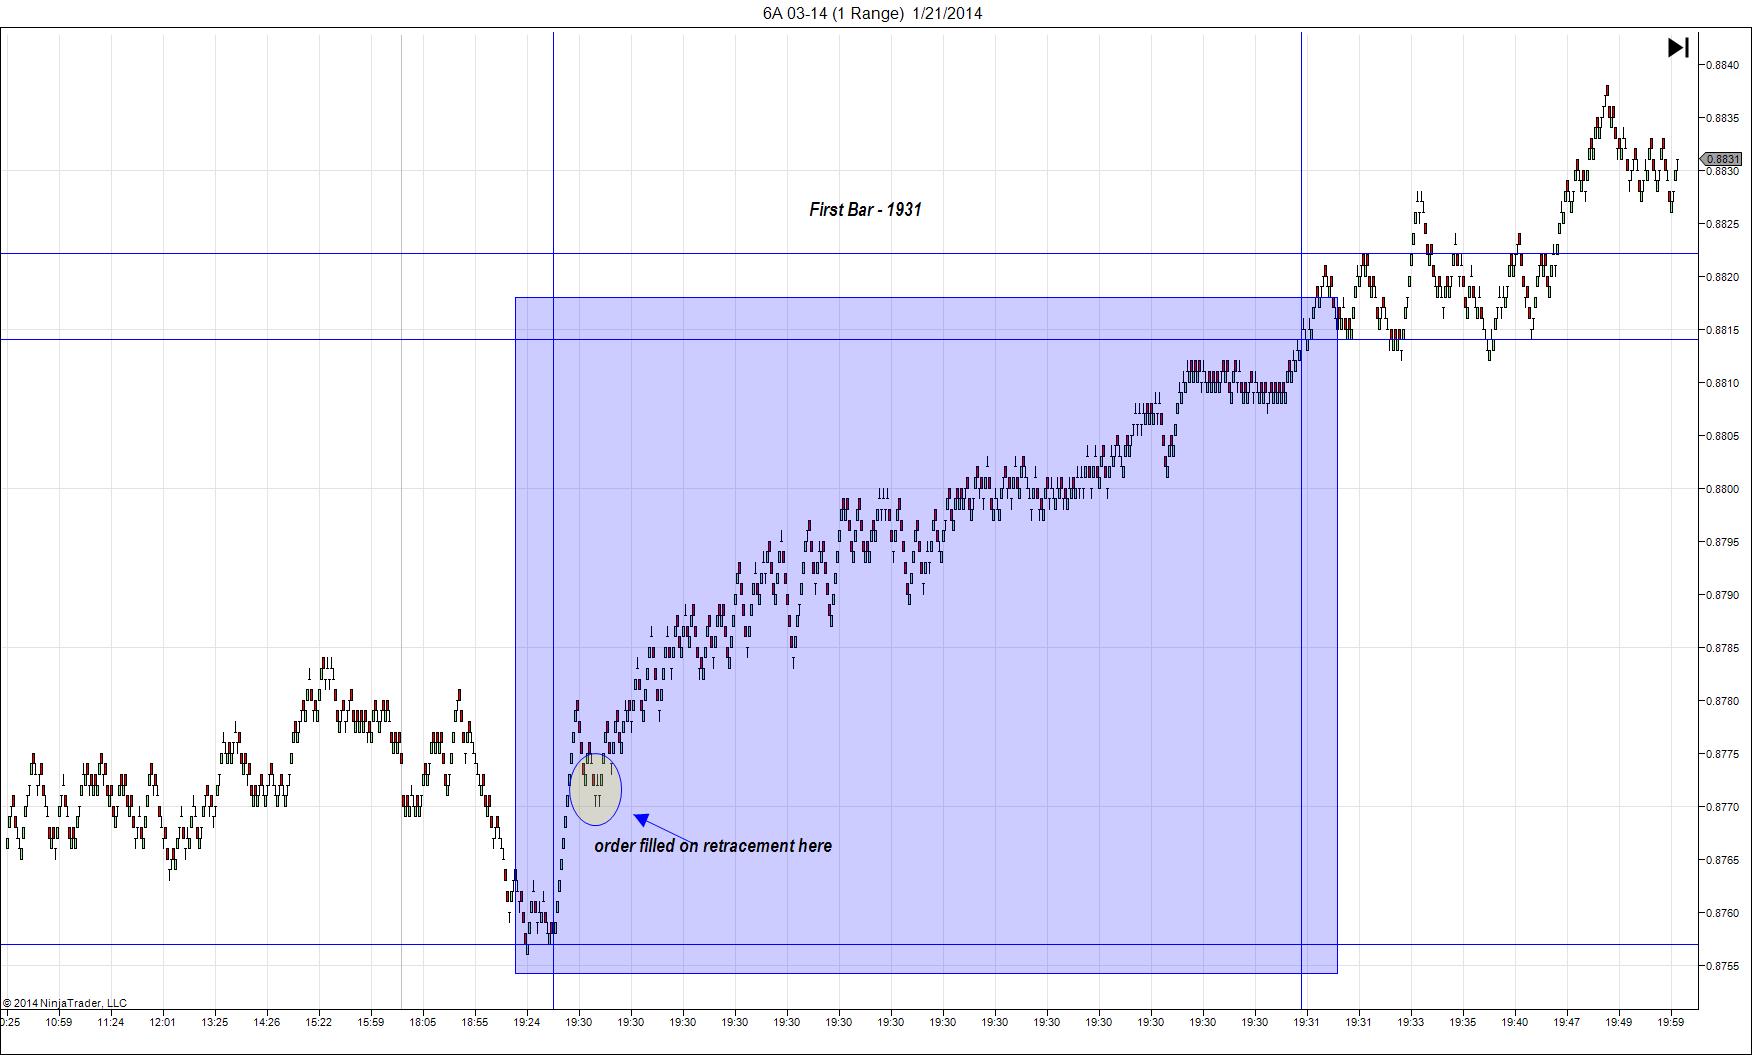
Pullback to 0.8930 – 1933 (3 min)
16 ticks
Extended Reversal to 0.8959 – 1943 (13 min)
63 ticks
Pullback to 0.8939 – 2046 (76 min)
20 ticks
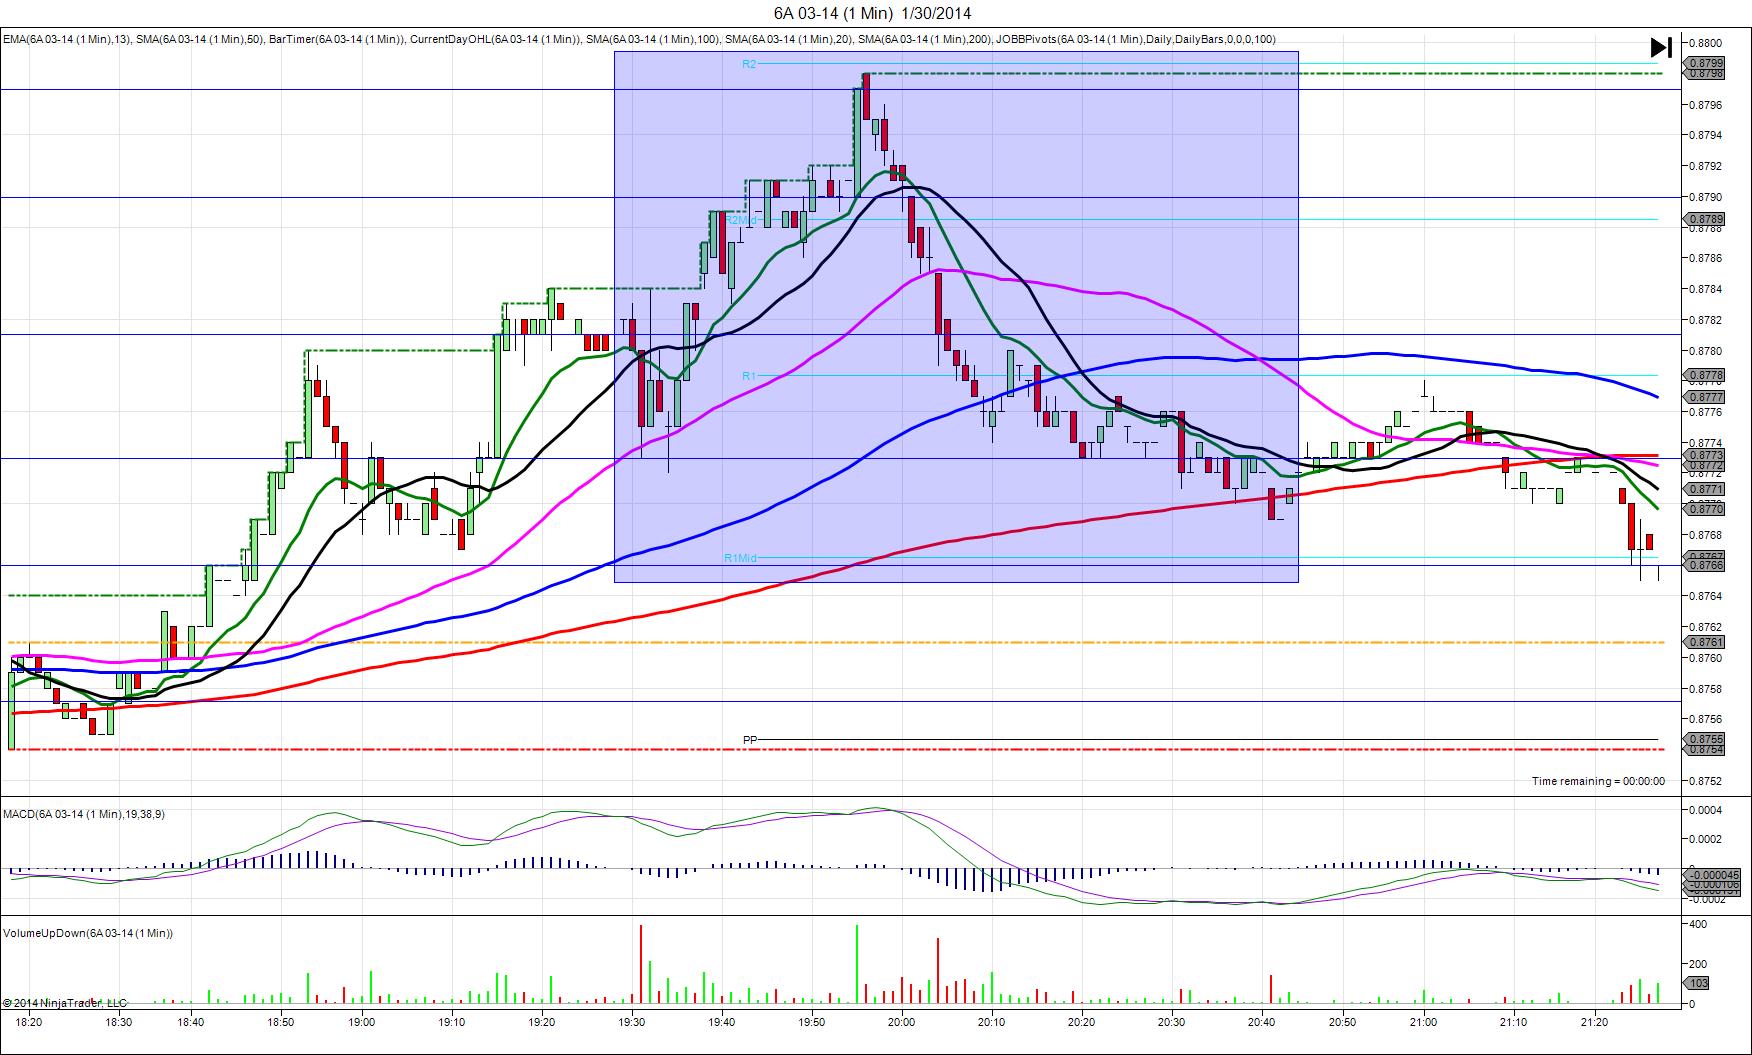
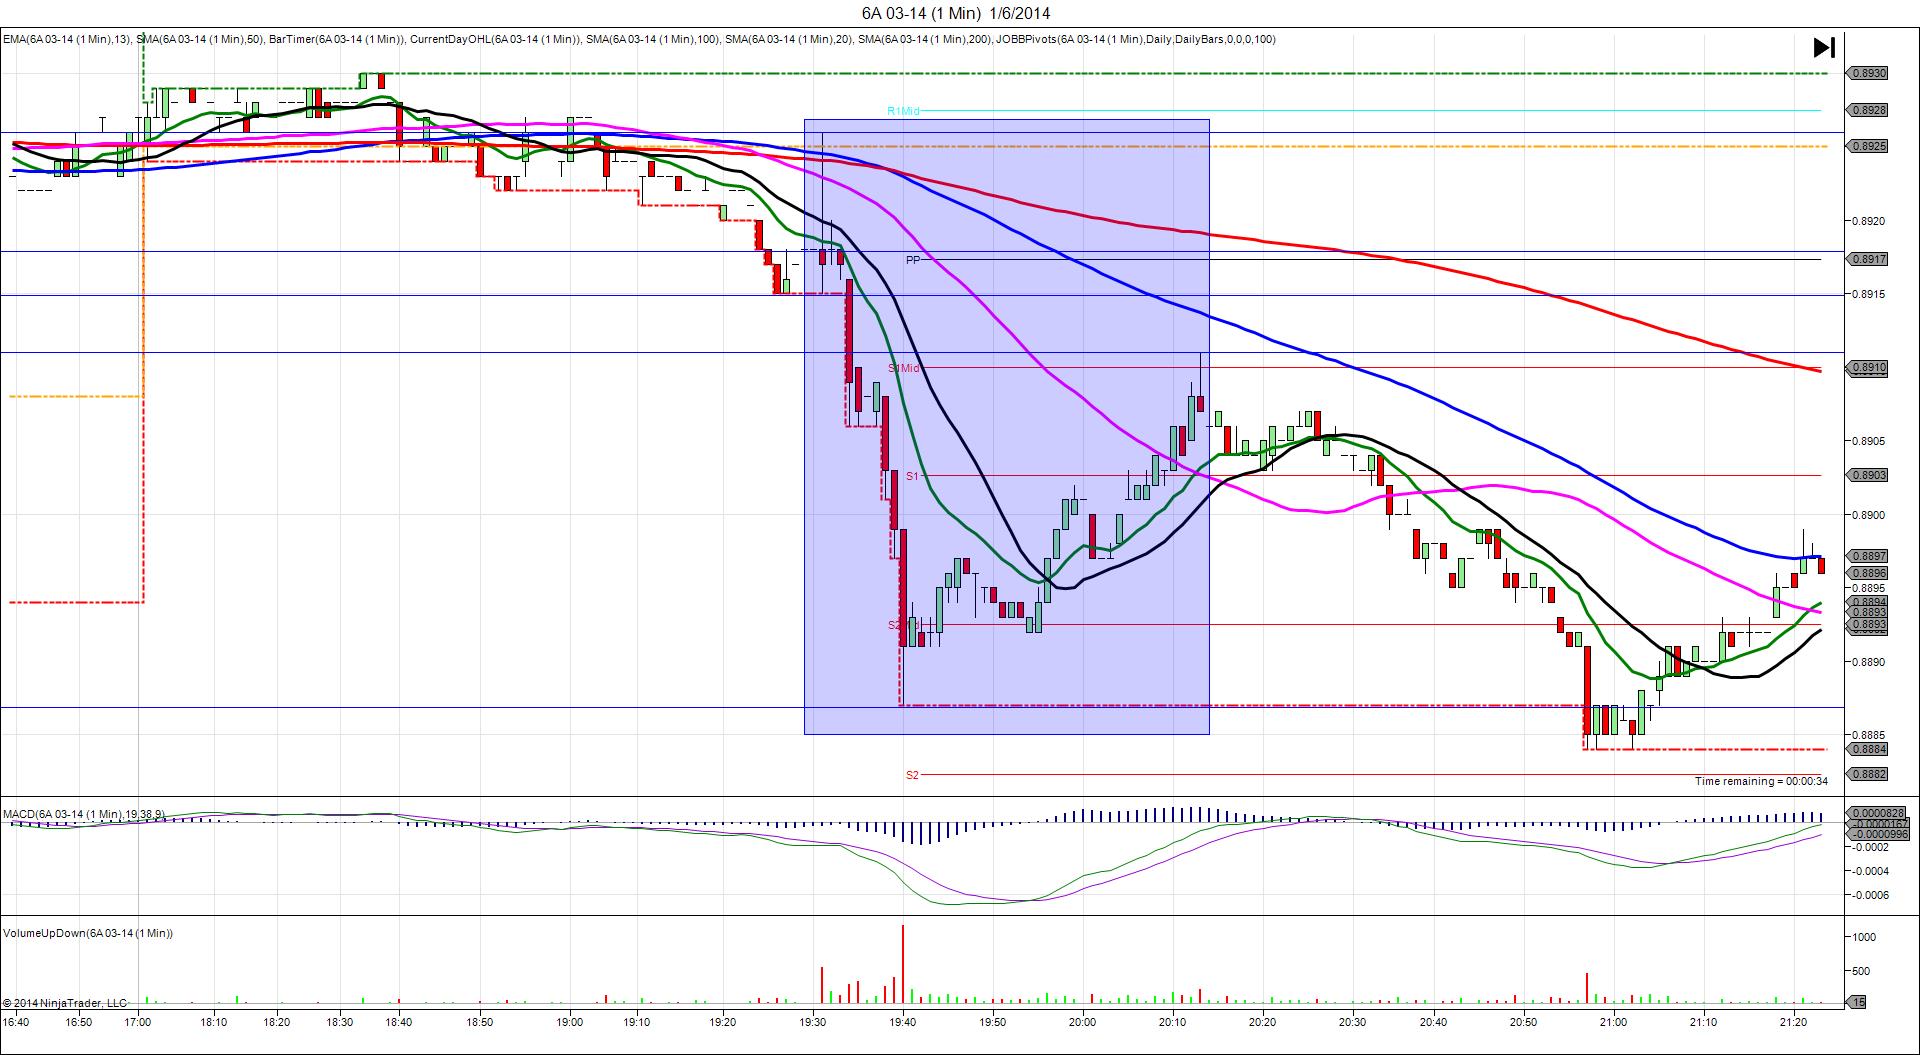
Trap Trade Bracket setup:
Long entries – 0.8897 (below the OOD/HOD and above the 200 SMA) / 0.8887 (just below the PP Pivot)
Short entries – 0.8929 (on the R2 Pivot) / 0.8937 (No SMA/Pivot near)
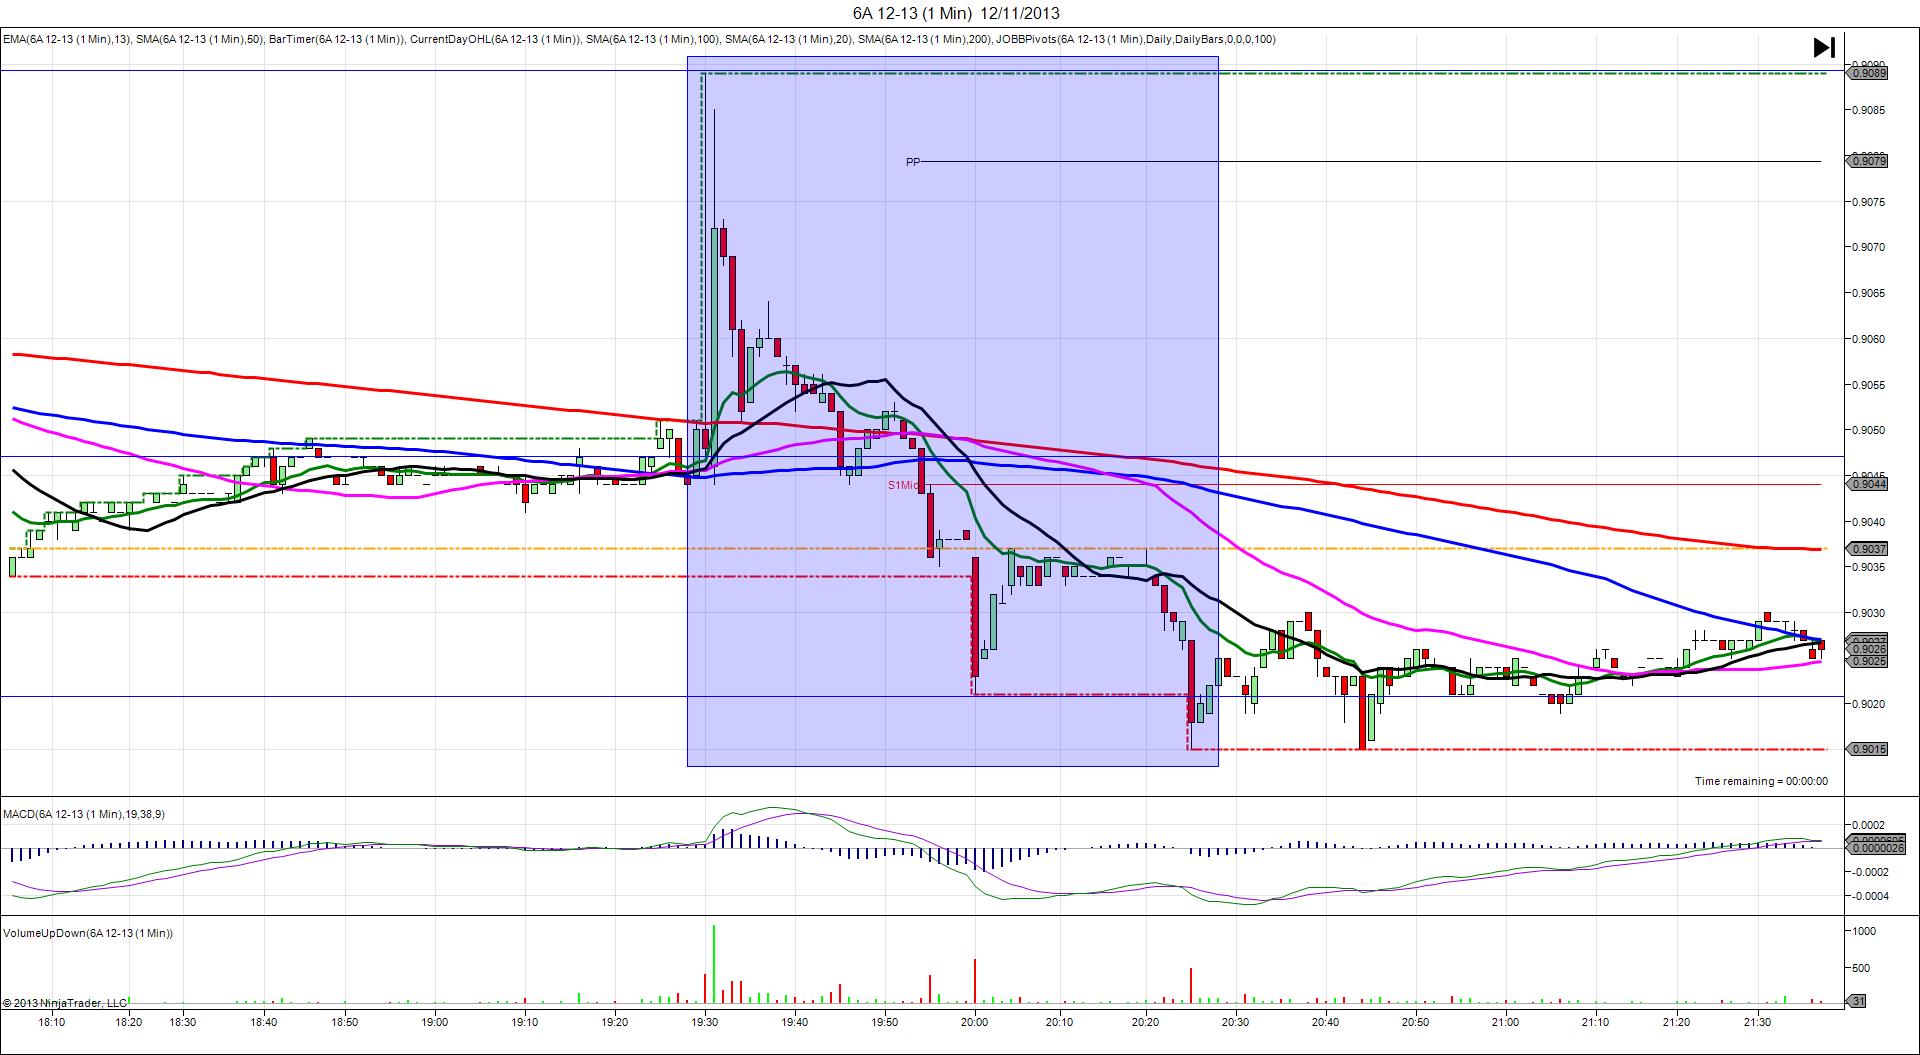
Notes: Retail Sales report matched the forecast with no previous revision, while the Trade Balance report strongly exceeded the forecast by 0.74B, with a sizeable upward previous report revision. This caused a dip downward of 16 ticks that quickly reversed course after hitting the 200 SMA, OOD and LOD to nearly reach the R3 Mid Pivot just after the :31 bar expired. Your inner tier long entry should have filled then given you about 30 ticks on the reversal long if you left it unchanged. If you moved it further up, as many as 50 ticks could have been captured easily. After the top was established, it pulled back 16 ticks on the next 2 bars before gearing up for an extended reversal of 13 more ticks as it eclipsed the R3 Mid Pivot. Then it traded sideways above the R3 Mid Pivot and eventually retreated to the 100 SMA about an hour later.