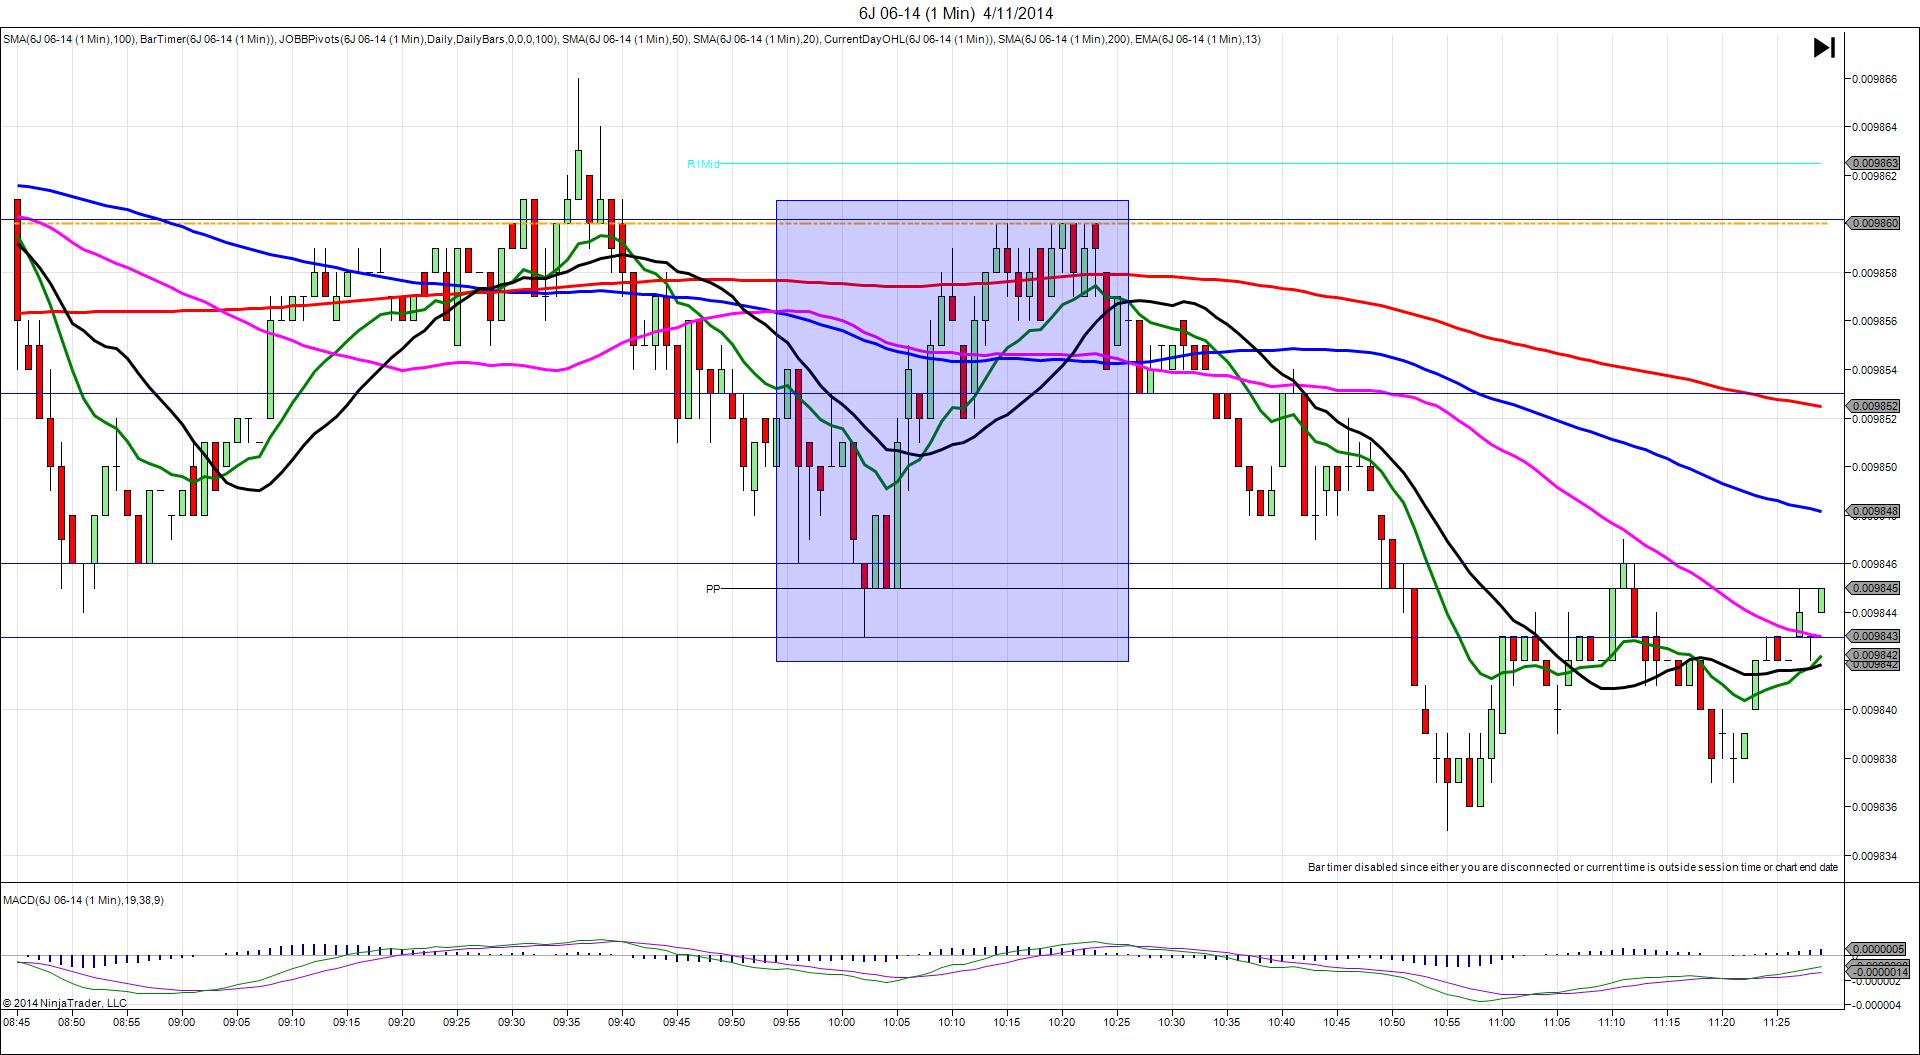
3/13/2014 Weekly Unemployment Claims (0830 EDT)
Forecast: 334K
Actual: 315K
TRAP TRADE (SPIKE WITH 2ND PEAK)
Anchor Point @ 0.009748 (last price)
————
Trap Trade:
)))1st Peak @ 0.009733 – 0830:02 (1 min)
)))-15 ticks
)))Reversal to 0.009742 – 0830:36 (1 min)
)))9 ticks
)))Double Bottom @ 0.009733 – 0831:34 (2 min)
)))-9 ticks
————
Reversal to 0.009744 – 0850 (20 min)
11 ticks
2nd Peak @ 0.009727 – 0922 (52 min)
21 ticks
Trap Trade Bracket setup:
Long entries – 0.009737 (just below the PP Pivot) / 0.009729 (just below the S1 Mid Pivot)
Short entries – 0.009760 (on the R2 Mid Pivot) / 0.009769 (just above the R2 Pivot)
Notes: Report came in strong with 19K less jobs than the forecast coupled with a mildly bullish retail sales report. This caused a short spike of 15 ticks that crossed the 50/100 SMAs near the origin and the PP Pivot closer to the bottom. This would have filled your inner long entry with 4 ticks to spare, then backed off to hover between 0.009741 and 42 for 10 sec allowing for an exit with 4-5 ticks quickly. If you let it continue, you would have seen it fall for a double bottom twice after the fill, then reverse for 11 ticks in the next 18 min. This would have allowed for a patient 7 ticks to be captured near the 50 SMA. After that it fell for a 2nd peak of 6 more ticks, crossing the OOD and S1 Mid Pivot after 30 min.