4/30/2014 Weekly Crude Oil Inventory Report (1030 EDT)
Forecast: 2.37M
Actual: 1.70M
Gasoline
Forecast: -0.60M
Actual: 1.56M
Distillates
Forecast: 0.58M
Actual: 1.94M
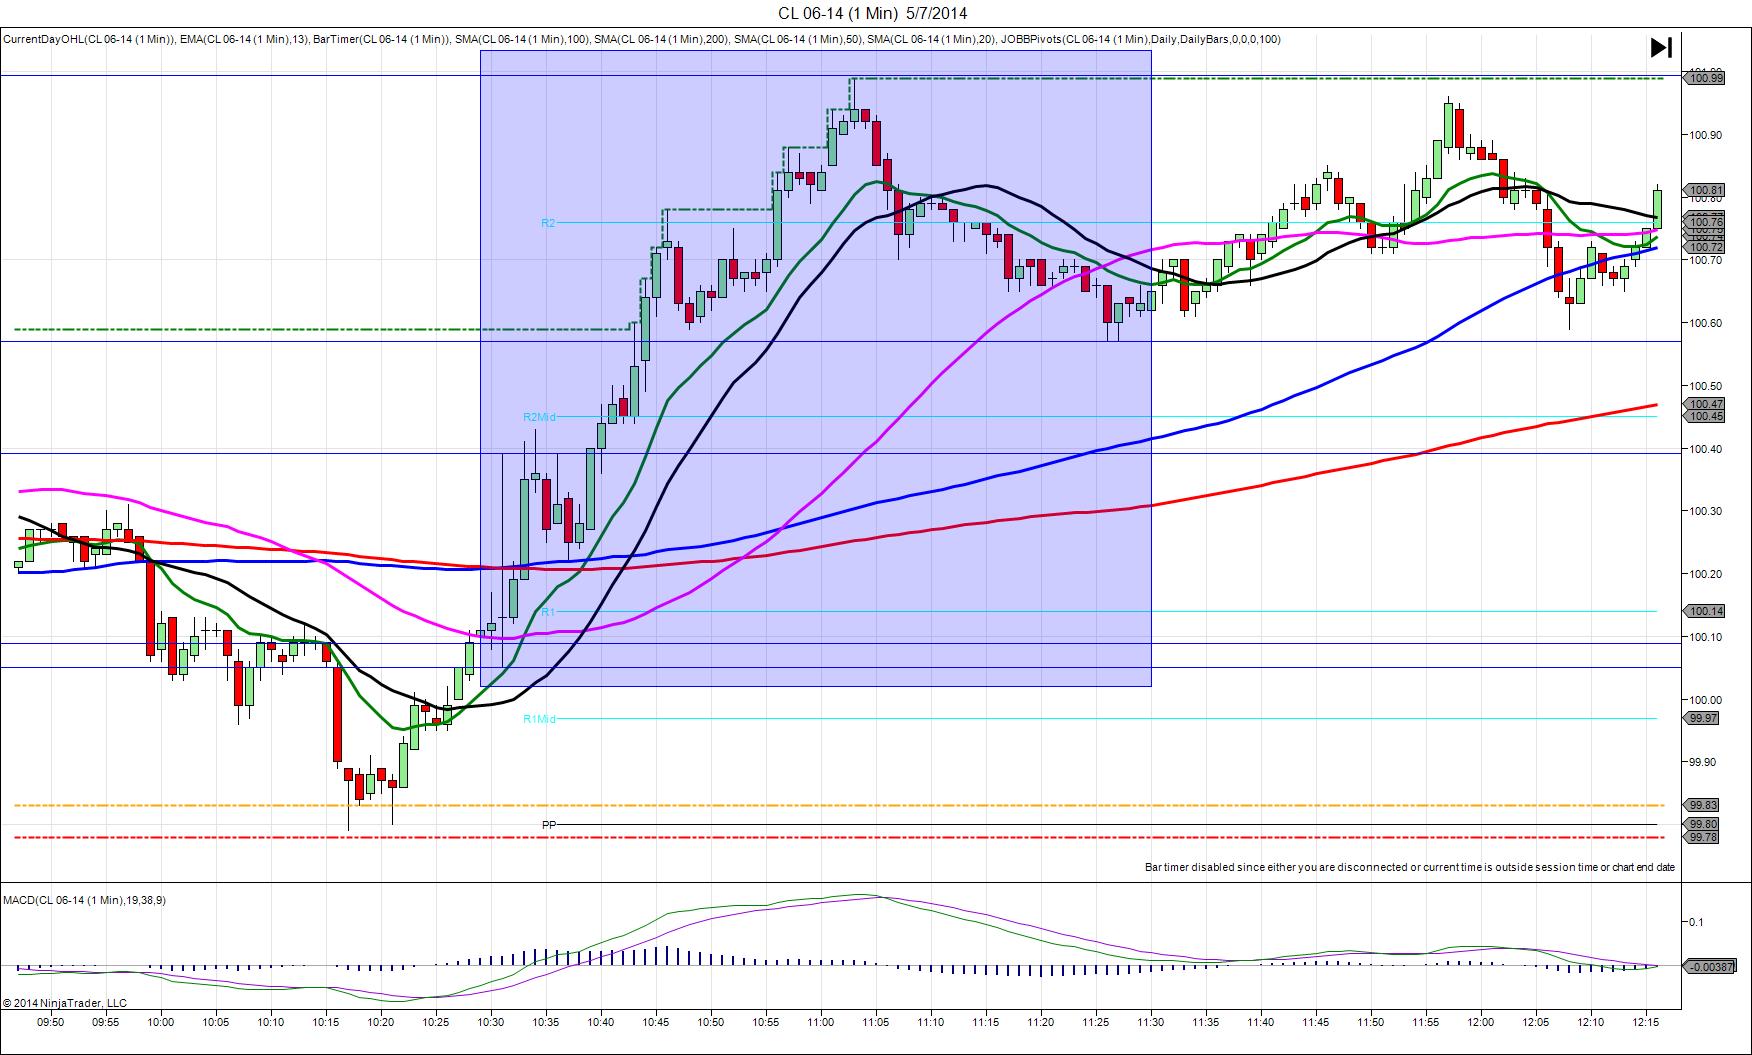
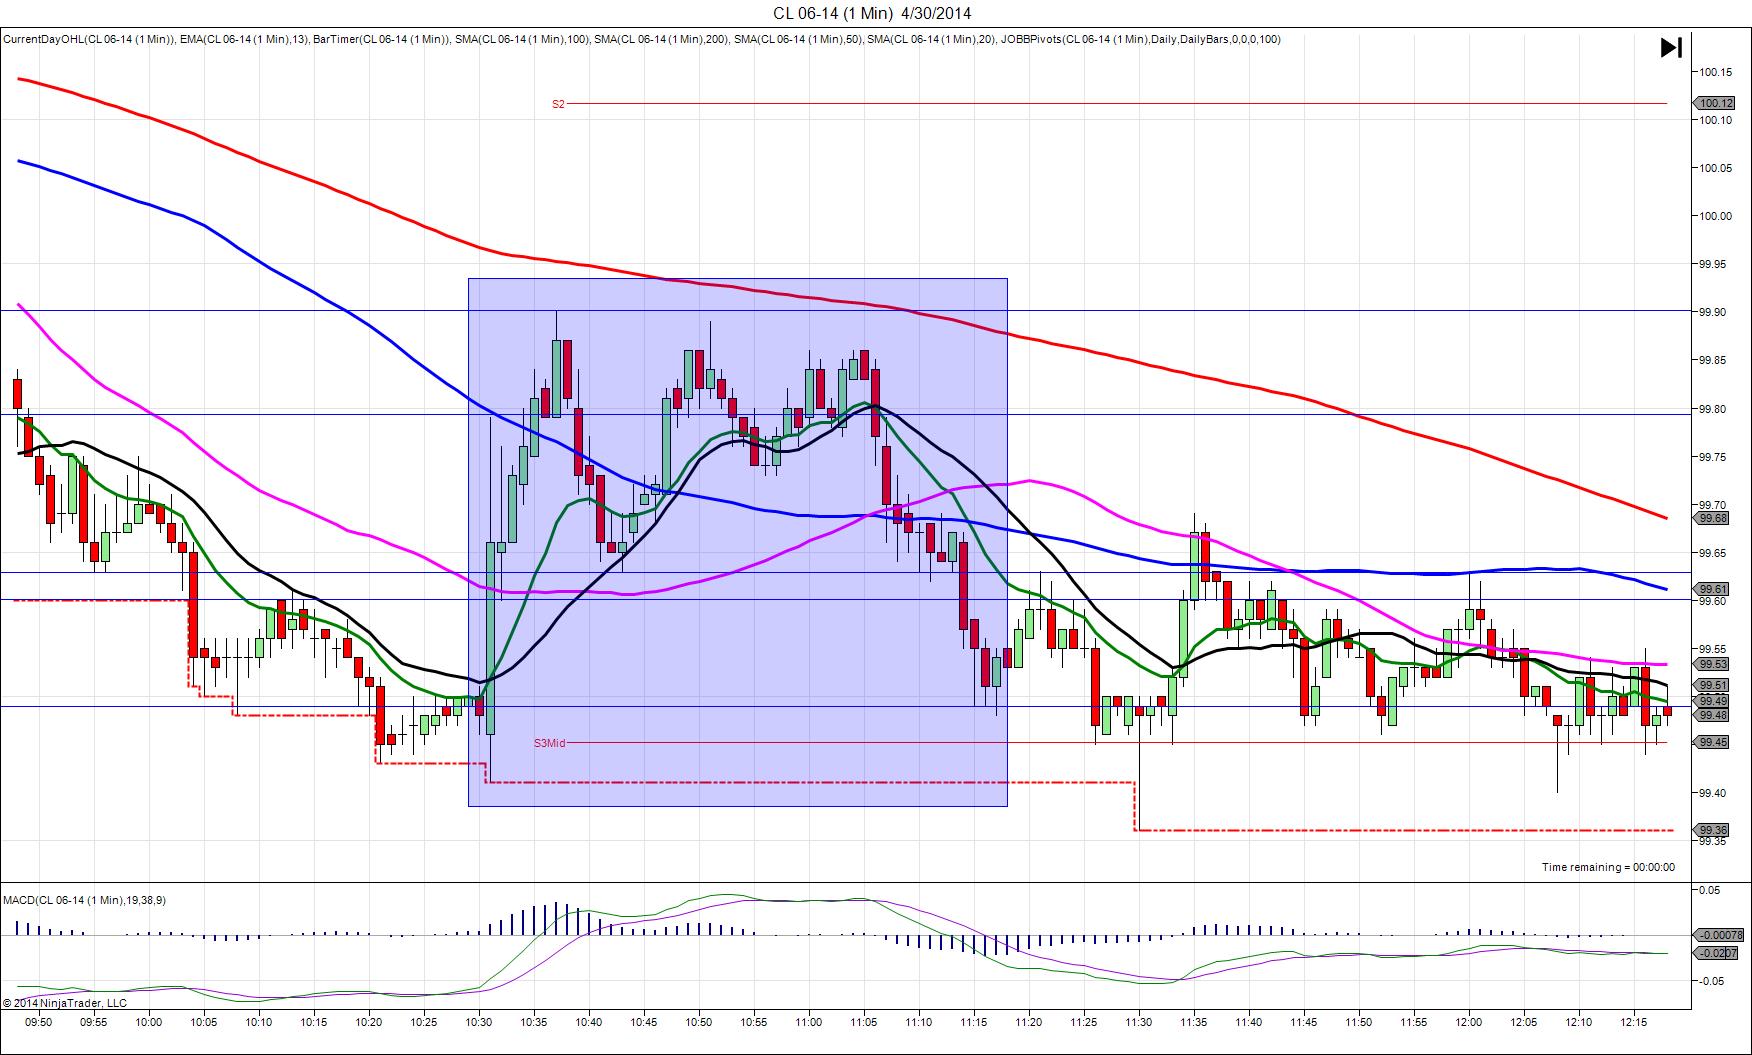
SPIKE WITH 2ND PEAK
Started @ 99.49
1st Peak @ 99.79 – 1030:35 (1 min)
30 ticks
Reversal to 99.60 – 1032 (2 min)
19 ticks
2nd Peak @ 99.90 – 1037 (7 min)
41 ticks
Reversal to 99.63 – 1043 (13 min)
27 ticks
Notes: Modest draw in inventories when a moderate gain was expected, while gasoline saw a modest gain when a negligible draw was expected, and distillates saw a moderate gain when a negligible gain was expected. The news was conflicting with the gas inventories gaining while the crude stocks fell. Usually this indicates a surprise increase in refinery production. This resulted in a 30 tick long spike that rose to cross the 50 and 100 SMAs. With JOBB and a 10 tick buffer, you would have seen a delayed reaction as the movement would have been contained within the bracket for 13 sec. The prudent course of action would be to cancel the order, but if you left it on the chart, it would have worked out in your favor for a fill long at about 99.59 with no slippage, then given you an opportunity to exit with about 10 ticks below the 100 SMA where it hovered. After a reversal of 19 ticks that retreated to the 50 SMA, it rose for a 2nd peak of 11 more ticks in the next 5 min. Then it reversed for 27 ticks in the next 6 min to the 20 SMA. After that it rose for a double top, chopped sideways, then fell back to the S3 Mid Pivot about an hour after the report.