
6/12/2014 Monthly Retail Sales (0830 EDT)
Core Forecast: 0.4%
Core Actual: 0.1%
Previous revision: +0.4% to 0.4%
Regular Forecast: 0.5%
Regular Actual: 0.3%
Previous Revision: +0.4% to 0.5%
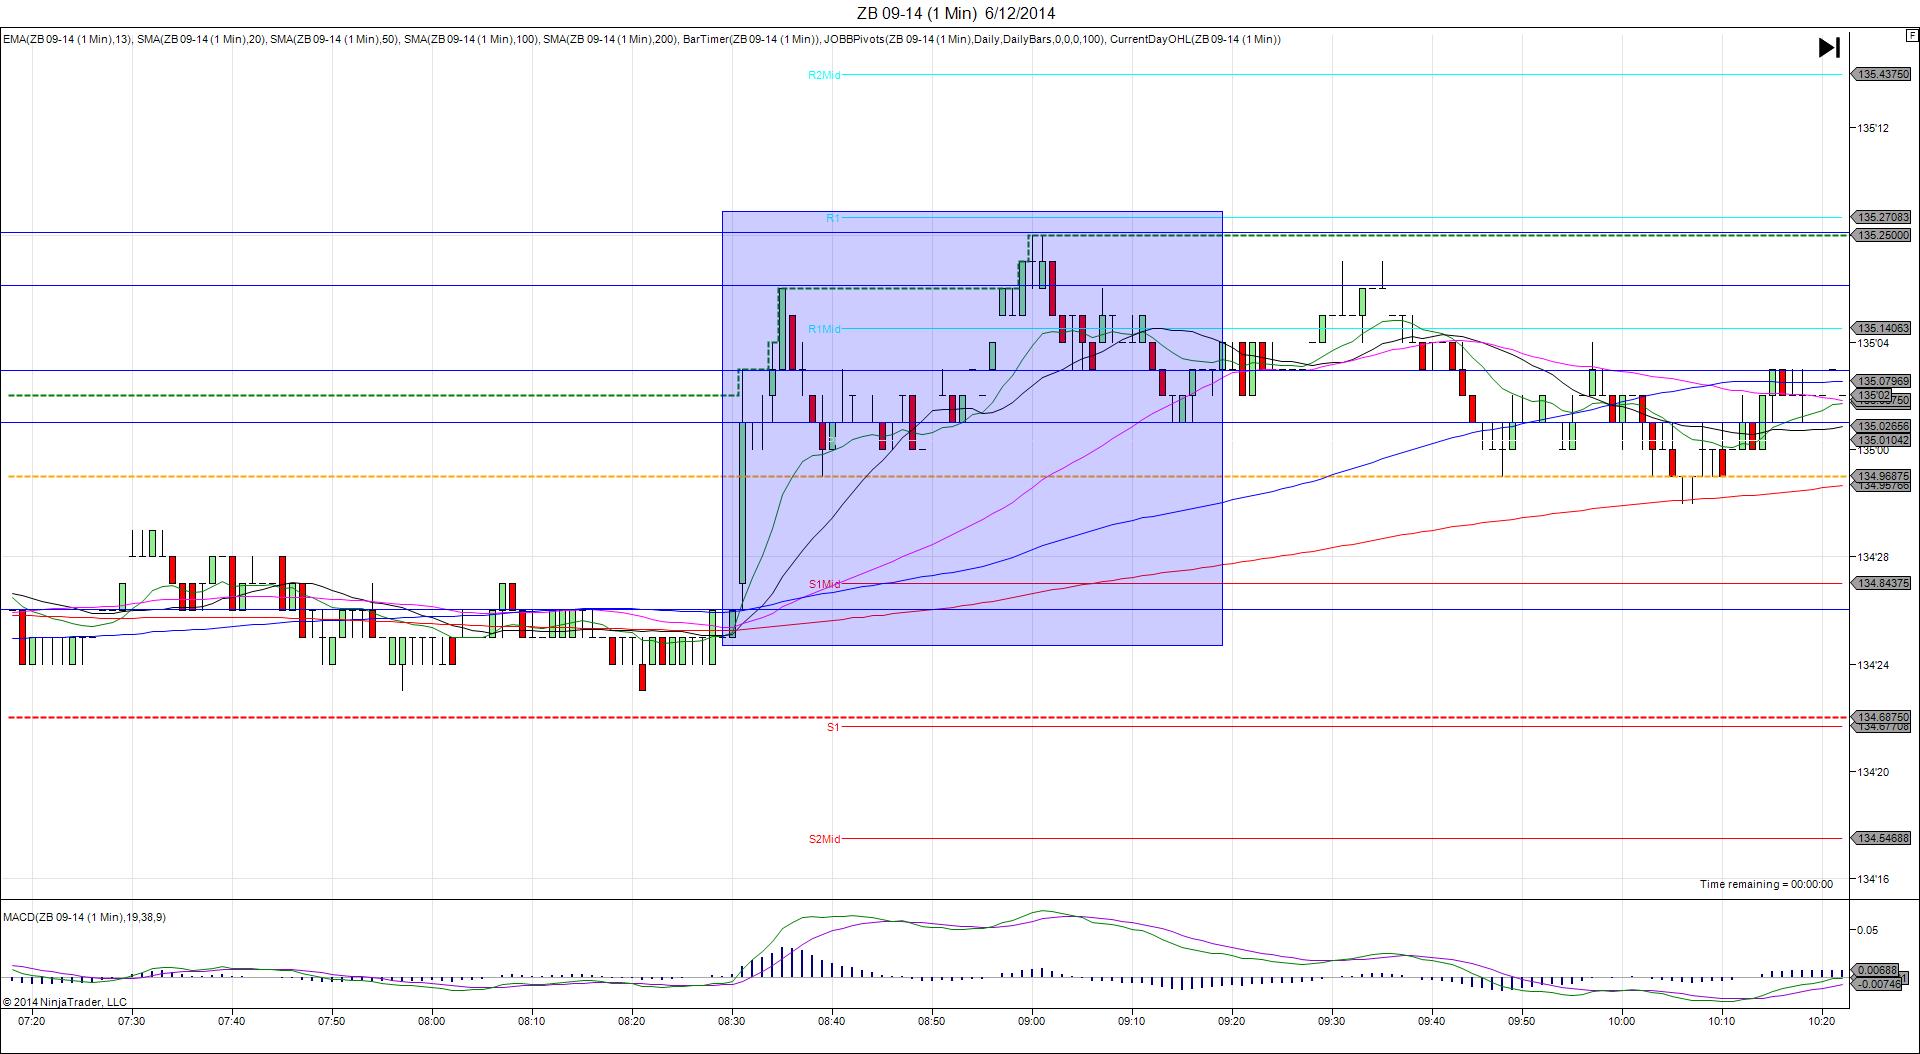
TRAP TRADE (SPIKE WITH 2ND PEAK)
Anchor Point @ 134’26 (last price)
————
Trap Trade:
)))1st Peak @ 135’00 – 0830:01 (1 min)
)))6 ticks
)))Reversal to 134’30 – 0830:12 (1 min)
)))-2 ticks
)))Pullback to 135’03 – 0830:39 (1 min)
)))5 ticks
————
Reversal to 135’00 – 0832 (2 min)
3 ticks
2nd Peak @ 135’06 – 0835 (5 min)
12 ticks
Reversal to 134’31 – 0839 (9 min)
7 ticks
Final Peak @ 135’08 – 0900 (30 min)
14 ticks
Reversal to 135’01 – 0914 (44 min)
7 ticks
Trap Trade Bracket setup:
Long entries – 134’22 (on the S1 Pivot / LOD) / 134’18 (on the S2 Mid Pivot)
Short entries – 134’30 (just below the OOD and R1 Mid Pivot) / 135’02 (on the HOD)
Notes: Report was double booked with unemployment claims, so we used the Trap Trade approach. All of the news was negative with core and regular retail sales falling 0.3% short of the forecast and claims exceeding the forecast while the previous revisions were large and bullish. This caused a long move of 6 ticks initially that crossed the OOD. This would have filled the inner short entry with 2 tick to spare, then backed off to hover near the fill point. Upon noticing the strong bias and lack of conflict in the news, look to exit near breakeven early in the :01 bar. After the initial seconds it continued to step higher in the next 30 min as it established a new high the then reversed for 7 ticks afterward.


