6J 09-14 (1 Min) 7.3.2014

 ISM Non-Manufacturing PMI  Comments Off on 6J 09-14 (1 Min) 7.3.2014
Jul 192014
 

6J 09-14 (1 Min)  7_3_2014

7/3/2014 Monthly ISM Non-Manufacturing PMI (1000 EDT)
Forecast: 56.2
Actual: 56.0
Previous Revision: n/a
DULL REACTION (NO FILL)
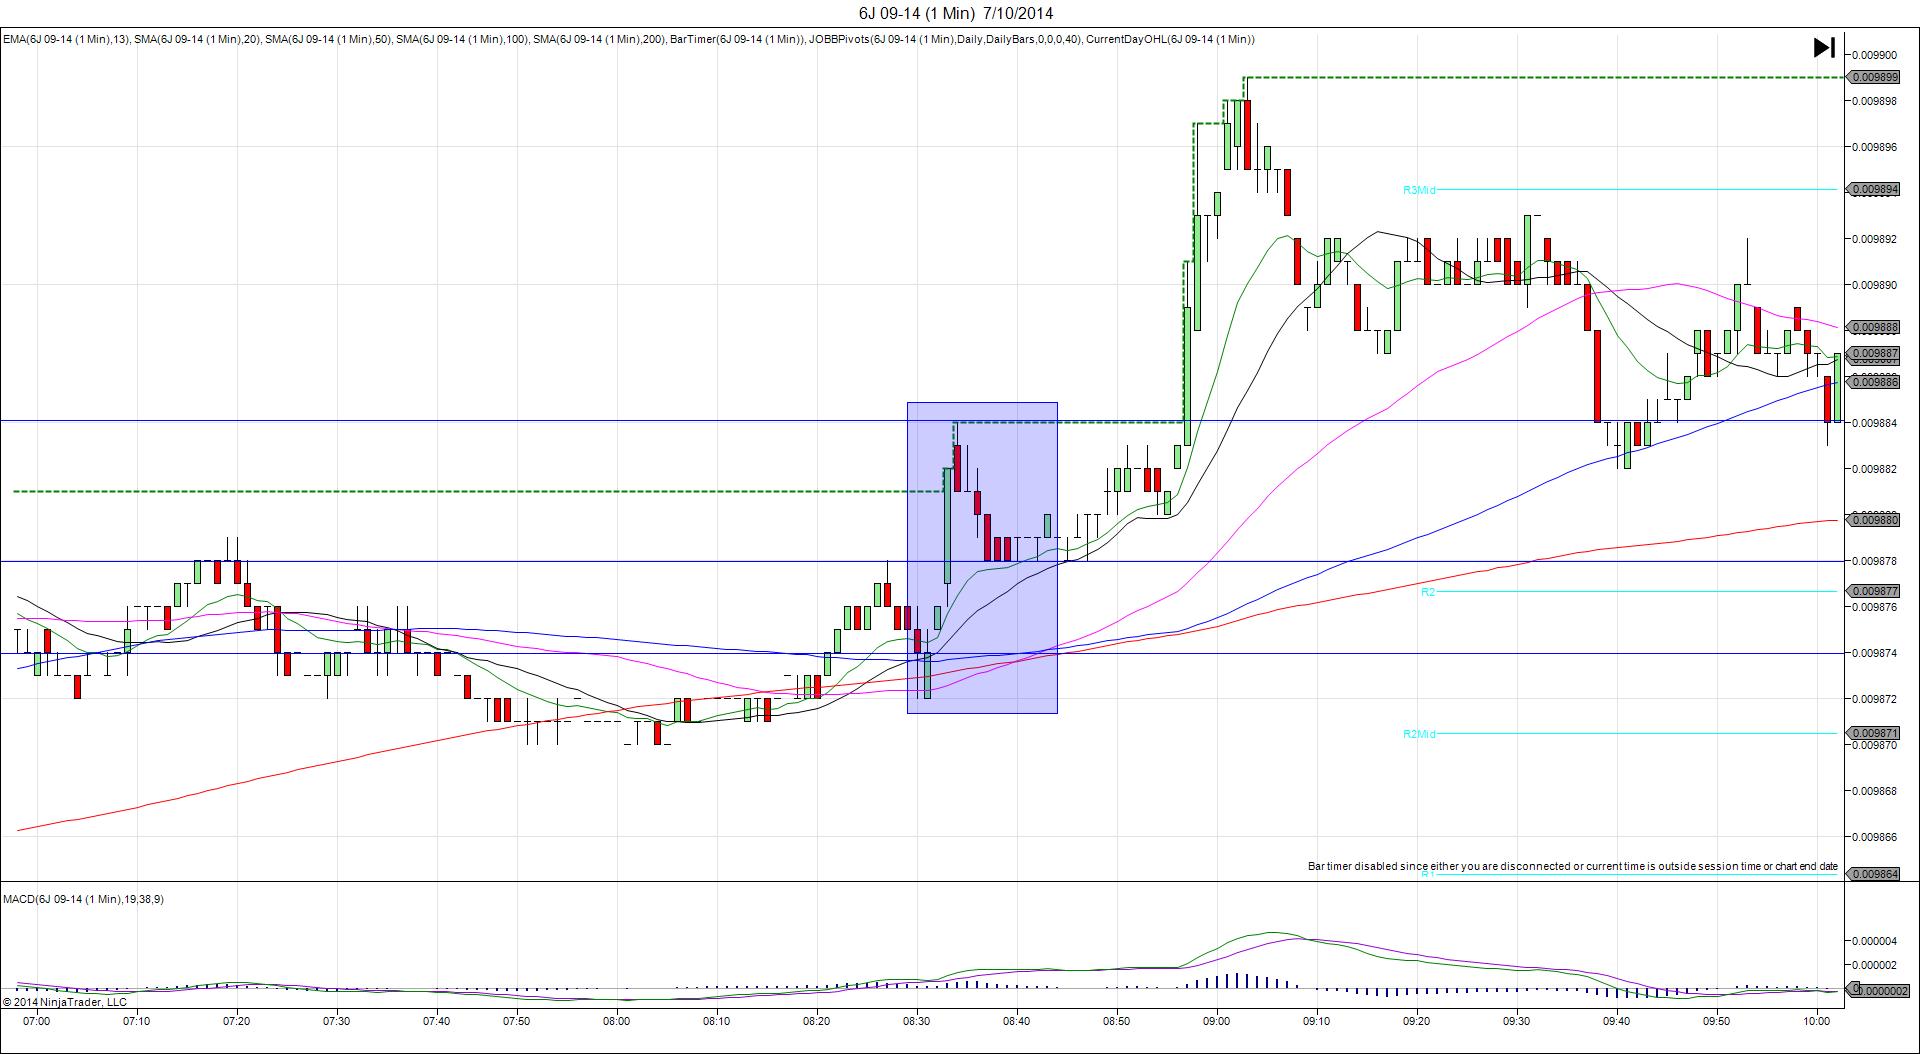
Started @ 0.009783
1st Bar Span 0.009785 – 0.009782 – 1001 (1 min)
+2/ -1 ticks

Reversal to 0.009802 – 10007 (7 min)
9 ticks

Notes: Nearly matching report fell short of the forecast by only 0.2 points. This caused a dull yawner of only 2 ticks movement from the origin. Since this was matching and would not have filled your order, cancel after 10 sec or less. The late long move was most likely a correction to the larger short move from the NFP report 90 min earlier.

NG 08-14 (1 Min) 7.10.2014

 NG Storage  Comments Off on NG 08-14 (1 Min) 7.10.2014
Jul 202014
 

NG 08-14 (1 Min)  7_10_2014

7/10/2014 Weekly Natural Gas Storage Report (1030 EDT)
Forecast: 92B
Actual: 93B
INDECISIVE…SPIKE / REVERSE
Started @ 4.168
1st Peak @ 4.114 – 1030:30 (1 min)
54 ticks

Reversal to 4.150 – 1034 (4 min)
36 ticks

Pullback to 4.120 – 1038 (8 min)
30 ticks

Reversal to 4.170 – 1048 (4 min)
50 ticks

Notes: We saw a near matching gain on the reserve compared to the forecast which caused an initial whipsaw followed by a moderate short spike. There was a premature spike at about 6 sec before the report that would not have affected the setup. The spike started on the SMAs and the S1 Mid Pivot and fell to cross the S2 Pivot and extend the LOD on the :31 bar for a total of 54 ticks. With JOBB, you would have filled short at about 4.141 with about 17 ticks of slippage, then seen it immediately stop you out on a quick retracement. After that it fell methodically to peak at the midpoint of the bar for 54 ticks. Then it reversed for 36 ticks in the next 3 bars to eclipse the S1 Pivot before pulling back for 30 ticks to the S2 Pivot 4 min later. Then it reversed to 50 ticks to the 200 SMA and S1 Mid Pivot.

NG 08-14 (1 Min) 7.17.2014

 NG Storage  Comments Off on NG 08-14 (1 Min) 7.17.2014
Jul 202014
 

NG 08-14 (1 Min)  7_17_2014

7/17/2014 Weekly Natural Gas Storage Report (1030 EDT)
Forecast: 99B
Actual: 107B
SPIKE WITH 2ND PEAK
Started @ 4.053
1st Peak @ 3.975 – 1030:42 (1 min)
78 ticks

2nd Peak @ 3.956 – 1035 (5 min)
97 ticks

Reversal to 3.980 – 1048 (18 min)
24 ticks

Notes: We saw a larger gain on the reserve compared to the forecast by 8k which caused a large short spike that fell 50 ticks in the first second. The spike started on the 100 SMA and fell to cross the S3 Pivot and extend the LOD on the :31 bar for a total of 78 ticks. With JOBB, you would have filled short at about 4.012 with about 31 ticks of slippage, then seen it trickle lower until hovering in the middle of the bar near the low. Look to exit with about 30-35 ticks. It never reversed before falling for a 2nd peak of 19 more tick after 4 more min to reach the S4 Mid Pivot. Then it reversed for 24 ticks in 13 min to reach the 20 SMA.

6J 09-14 (1 Min) 7.10.2014

 Unemployment Weekly  Comments Off on 6J 09-14 (1 Min) 7.10.2014
Jul 212014
 

6J 09-14 (1 Min)  7_10_2014

7/10/2014 Weekly Unemployment Claims (0830 EDT)
Forecast: 316K
Actual: 304K
TRAP TRADE (DULL -NO FILL)
Anchor Point @ 0.009874 (last price)
————
Trap Trade:
)))1st Bar Span 0.009872 – 0.009875 – 0831 (1 min)
)))3 ticks
————
Delayed Peak @ 0.009884 – 0834 (4 min)
10 ticks

Reversal to 0.009878 – 0837 (7 min)
6 ticks

Trap Trade Bracket setup:
Long entries – 0.009864 (on the R1 Pivot) / 0.009854 (on the OOD)
Short entries – 0.009882 (just above the HOD) / 0.009894 (on the R3 Mid Pivot)

Notes: Report came in impressive with 12k less jobs lost than the forecast. It was almost like the market was not paying attention as there was no impulse after the release as the :31 bar only moved 3 ticks. The movement would have been well inside of the inner tiers, so cancel the order. It ended up causing a delayed long move of 10 ticks on the :34 bar to the HOD, then a reversal of 6 ticks 3 min later.

ZC 12-15 (1 Min) 7.10.2015

 WASDE - Corn  Comments Off on ZC 12-15 (1 Min) 7.10.2015
Aug 252015
 

ZC 12-15 (1 Min) 7_10_2015

7/10/2015 World Agriculture Supply and Demand Estimates (WASDE) – Corn (1200 EDT)
Forecast: n/a
Actual: n/a
SPIKE WITH 2ND PEAK
Started @ 441.75
1st Peak @ 436.00 – 1200:19 (1 min)
23 ticks

Reversal to 442.50 – 1200:37 (1 min)
26 ticks

2nd Peak @ 434.25 – 1201:46 (2 min)
30 ticks

Reversal to 449.00 – 1229 (29 min)
59 ticks

Pullback to 444.50 – 1238 (38 min)
18 ticks

Notes: Report Reaction caused short spike of 23 ticks in 19 sec that eclipsed the S1 Mid Pivot / LOD. With JOBB and a 5 tick bracket, your short entry would have filled at 440.50 with no slippage, then look to exit at about 436.75 with 15 ticks where it hovered for 10 sec at the S1 Mid Pivot. After that it reversed 26 ticks to the R1 Pivot in 18 sec before falling for a 2nd peak of 7 more ticks in 1 min to the S1 Pivot. Then it reversed 59 ticks in 27 min after crossing the R2 Pivot and extending the HOD before pulling back 18 ticks to the R2 Mid Pivot / 50 SMA in 9 min.

ZS 11-14 (1 Min) 7.11.2014

 WASDE - Beans  Comments Off on ZS 11-14 (1 Min) 7.11.2014
Jul 242014
 

ZS 11-14 (1 Min)  7_11_2014 ZS 11-14 (Second)  7_11_2014

7/11/2014 World Agriculture Supply and Demand Estimates (WASDE) – Soybeans (1200 EDT)
Forecast: n/a
Actual: n/a
SPIKE / REVERSE
Started @ 1087.25 (1200:32)
1st Peak @ 1096.00 – 1200:39 and 1200:44 (1 min)
35 ticks

Reversal to 1075.50 – 1202:52 (3 min)
82 ticks

Pullback to 1081.00 – 1204 (4 min)
22 ticks

Reversal to 1065.00 – 1211 (11 min)
64 ticks

Pullback to 1083.75 – 1215 (15 min)
75 ticks

Notes: With the beans, we recommend a delayed setup at 32 sec. In this case it would have been tame between 26 and 33 seconds for a safe setup. With the anchor point of 1087.25, your long entry would have filled at 1089 with 1 tick of slippage, then allowed up to 28 ticks to be captured, so a 25 tick profit target would have been perfect. The top was short lived as it eclipsed the OOD / S1 Mid Pivot and nearly hit the HOD then fell 82 ticks in about 2 min to eclipse the S2 Pivot. After a quick pullback of 22 ticks, it fell another 64 ticks in about 7 min to the S3 Mid Pivot. Then it pulled back for 75 ticks to nearly reach the 50 SMA before it collapsed and settled down.

6J 09-14 (1 Min) 7.17.2014

 Unemployment Weekly  Comments Off on 6J 09-14 (1 Min) 7.17.2014
Aug 042014
 

6J 09-14 (1 Min)  7_17_2014

7/17/2014 Weekly Unemployment Claims (0830 EDT)
Forecast: 310K
Actual: 302K
TRAP TRADE (DULL -NO FILL)
Anchor Point @ 0.009854 (last price)
————
Trap Trade:
)))1st Peak @ 0.009862 – 0830:02 (1 min)
)))8 ticks

)))Reversal to 0.009858 – 0834:27 (5 min)
)))-4 ticks
————

Trap Trade Bracket setup:
Long entries – 0.009846 (just below the R2 Mid Pivot) / 0.009834 (just below the PP Pivot)
Short entries – 0.009864 (just below the R3 Pivot) / 0.009874 (just above the R4 Mid Pivot)

Notes: Report came in impressive with 10k less jobs lost than the forecast. Building Permits / Housing Starts were released at the same time and came in disappointing. This caused an 8 tick long spike that crossed all 3 Major SMAs and the R3 Mid Pivot. The move would have probably missed the inner tier short order by 1 or 2 ticks, so cancel the order. After the spike it took over 4 min to reverse for a meager 4 ticks, so if you have been filled, you would have had an opportunity to exit between 1 and 4 ticks. After that it was tame and traded sideways.

6J 09-14 (1 Min) 7.18.2014

 Prelim UoM Consumer Sentiment  Comments Off on 6J 09-14 (1 Min) 7.18.2014
Aug 042014
 

6J 09-14 (1 Min)  7_18_2014

7/18/2014 Prelim UoM Consumer Sentiment (0955 EDT)
Forecast: 83.5
Actual: 81.3
TRAP TRADE (DULL – No Fill)
Anchor Point @ 0.0009866 (last price)
————
Trap Trade:
)))1st Bar Span 0.009866 – 0.009867 – 0831 (1 min)
)))1 tick
————

Trap Trade Bracket setup:
Long entries – 0.009858 (just below the S1 Mid Pivot / S2 Mid Pivot) / 0.009851 (just below the S1 Pivot)
Short entries – 0.009874 (no SMA/Pivot near) / 0.009880 (just above the R1 Mid Pivot)

Notes: Report came in lower than the forecast by 2.2 points causing no reaction as the :56 bar barely moved. With no impulse, It did not leave an opportunity to move the order closer either, so cancel the order.

6J 09-14 (1 Min) 7.24.2014

 Unemployment Weekly  Comments Off on 6J 09-14 (1 Min) 7.24.2014
Aug 042014
 

6J 09-14 (1 Min)  7_24_2014

7/24/2014 Weekly Unemployment Claims (0830 EDT)
Forecast: 310K
Actual: 284K
TRAP TRADE (DULL -NO FILL)
Anchor Point @ 0.009836 (last price)
————
Trap Trade:
)))1st Peak @ 0.009828 – 0830:01 (1 min)
)))-8 ticks

)))Reversal to 0.009833 – 0830:22 (1 min)
)))5 ticks
————
Continued Reversal to 0.009836 – 0833 (3 min)
8 ticks

Double Bottom @ 0.009828 – 0840 (10 min)
8 ticks

Reversal to 0.009836 – 0903 (33 min)
8 ticks

Trap Trade Bracket setup:
Long entries – 0.009828 (just below the S3 Mid Pivot) / 0.009818 (just below the S3 Pivot)
Short entries – 0.009845 (just below the 200 SMA/S1 Pivot) / 0.009855 (between the PP/S1 Mid Pivots)

Notes: Report came in impressive with 26k less jobs lost than the forecast and also came in well under 300K for the first time in years. This caused an 8 tick short spike that crossed the S3 Mid Pivot and extended the LOD then retreated quickly. The move would have filled your inner long entry if you used 8 ticks, but would have missed if anything larger. If filled, look to exit at about 0.009833 with 5 ticks in the later part of the :31 bar as the strongly biased news is likely to cause a drop again. It continued to reverse for 3 more ticks in the next 2 min to reach the 13 SMA. Then it fell for a double bottom 7 min later and reversed for 8 ticks after another 23 min as it crossed the 50 SMA.

CL 09-14 (1 Min) 7.16.2014

 Oil Inventory  Comments Off on CL 09-14 (1 Min) 7.16.2014
Aug 072014
 

CL 09-14 (1 Min)  7_16_2014

7/16/2014 Weekly Crude Oil Inventory Report (1030 EDT)
Forecast: -2.09M
Actual: -7.53M
Gasoline
Forecast: 0.60M
Actual: 0.17M
Distillates
Forecast: 1.76M
Actual: 2.53M
SPIKE WITH 2ND PEAK
Started @ 99.73
1st Peak @ 100.34 – 1031:46 (2 min)
61 ticks

Reversal to 99.89 – 1054 (24 min)
45 ticks

2nd Peak @ 100.41 – 1118 (48 min)
68 ticks

Reversal to 99.92 – 1147 (77 min)
49 ticks

Notes: large draw in inventories when a moderate draw was expected, while gasoline saw a negligible gain when a greater gain was expected, and distillates saw a moderate gain when a lesser gain was expected. Overall, the large draw on the crude drove the results as we saw a large long spike of 61 ticks over 2 bars that crossed the R3 Mid Pivot. It kept steadily climbing with the only real resistance barrier being the HOD. After the third challenge, it rose higher to attack the R3 Mid Pivot. With JOBB and a 10 tick buffer, you would have filled long at 99.87 with 4 ticks of slippage. Given the strong results, you could have played it conservative and exited at about 100.05 or waited for the impulse to go another 20 or so ticks. This would have allowed up to 40+ ticks to be captured. After the peak, it reversed for 45 ticks in 24 min to the 50 SMA. Then it rallied for a minor 2nd peak of 7 more ticks after another 24 min before falling 49 ticks in about 30 min to nearly reach the 200 SMA.