2/11/2015 Weekly Crude Oil Inventory Report (1030 EST)
Forecast: 3.73M
Actual: 4.87M
Gasoline
Forecast: 0.20M
Actual: 1.98M
Distillates
Forecast: -0.82M
Actual: -3.25M
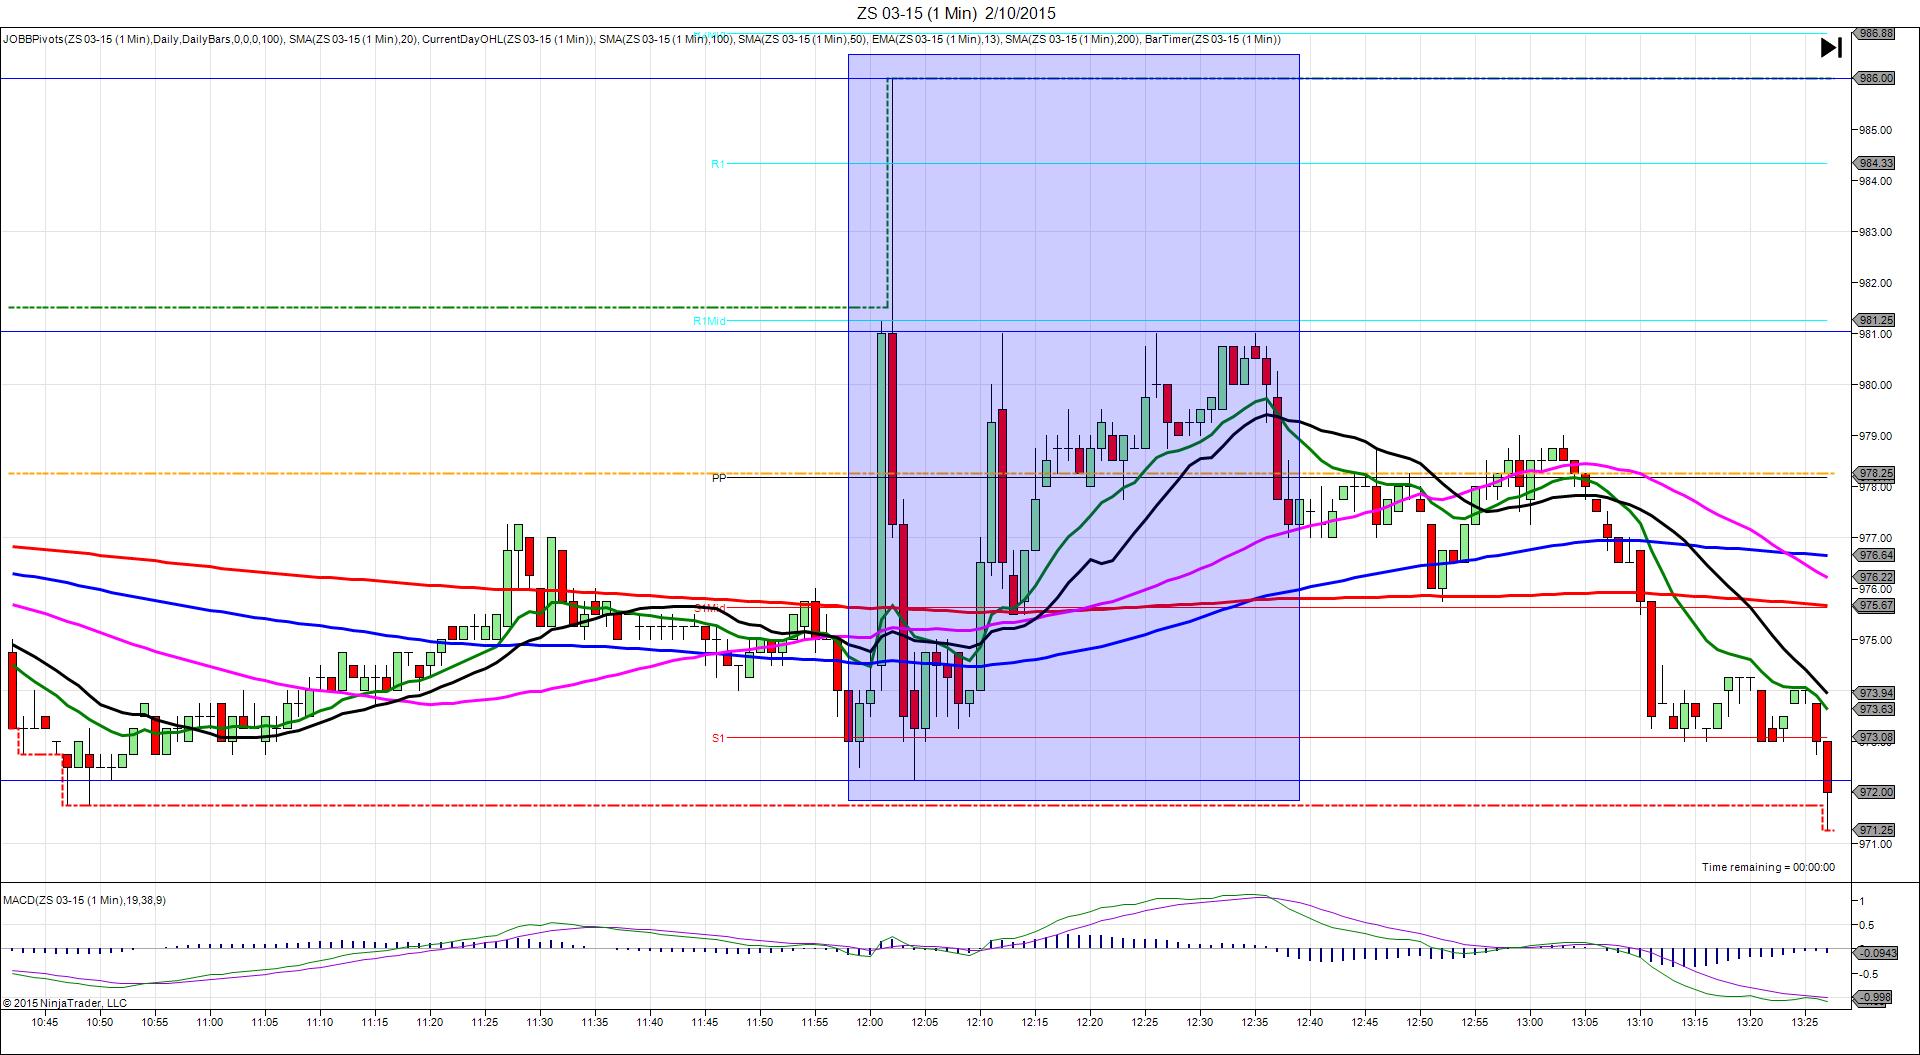
SPIKE / REVERSE
Started @ 48.74
1st Peak @ 48.05 – 1031:19 (2 min)
69 ticks
Reversal to 48.45 – 1033 (3 min)
40 ticks
Pullback to 48.18 – 1035 (5 min)
27 ticks
Reversal to 50.01 – 1223 (113 min)
183 ticks
Notes: Another large gain in inventories when a healthy gain was expected, while gasoline saw a modest gain when a negligible gain was expected, and distillates saw a moderate draw when a negligible draw was expected. This caused a short move that started on the 13 SMA and fell slowly and methodically for 69 ticks in about 80 sec. With JOBB and a 10 tick buffer, you would have filled short at about 48.61 with 3 ticks of slippage, then you would have seen it fall and eclipse the S2 Pivot allowing up to 55 ticks to be captured. After that it reversed 40 ticks in 2 min before pulling back 27 ticks in 2 min to fall short of the S2 Pivot. Then it reversed 183 ticks in 108 min to the S1 Mid Pivot.